The post Learning to Trade a Bear Flag Pattern by Jay and Julie Hawk appeared first on Benzinga. Visit Benzinga to get more great content like this.
Pattern recognition is a cornerstone of technical analysis and one of the most useful tools for traders operating in financial markets. The bear flag pattern has long been a popular and reliable trading signal used by technical traders in the markets to identify the likely continuation of a downtrend.
It doesn’t matter if you prefer to trade forex, stocks or commodities, since learning about trading bear flag patterns can benefit operators in all financial markets. All you need is a price or exchange rate chart and a sharp eye to potentially profit from identifying this common and reliable chart pattern.
In this article, Benzinga examines the definition and meaning of a bearish flag pattern, how to identify the pattern on an exchange rate chart and the limitations of bear flag trading. The article also includes a concrete example of trading forex using a popular bear flag strategy and examines how bear flags compare with bull flags.
Earn cash back on your FX trades
Open an account in as little as 5 minutes. Spot opportunities, trade and manage your positions from a full suite of mobile and tablet apps.
Table of contents
[Show]
What is a Bear Flag Pattern?
In the technical analysis of financial markets, a flag is a classic pattern appearing on a chart that shows a tight consolidation in the price or exchange rate movement of a tradable asset after a sharp directional movement. The consolidation phase of a flag pattern can consist of a horizontal range or a weak counter-trend channel enclosed by parallel trend lines.
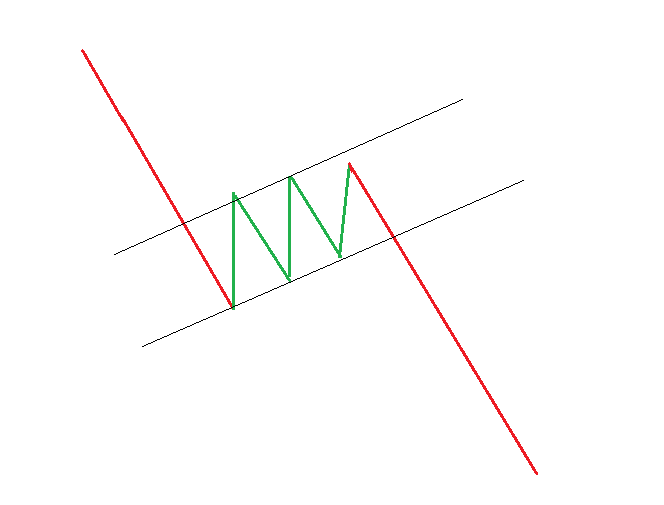
Schematic diagram of a bear flag chart pattern. Source: Learn.ByBit.com
As the schematic diagram above shows, the initial part of a flag pattern looks somewhat like a flag with the sharp movement making up the mast or flagpole and the subsequent consolidation pattern representing the flag. The flag pattern typically completes in a second sharp move in the same direction as the flagpole and to roughly the same extent as the height of the flagpole.
Flags are considered continuation patterns by technical analysts since they generally further the prevailing trend. Flag patterns can be used to identify the likely extent of the continuation of a sharp trend after the price has briefly consolidated or traded against the original trend.
A bull flag occurs in an upwards trend and is a bullish chart pattern. In contrast, a bear flag is a bearish chart pattern that occurs in a downtrend.
The image below shows an example of a classic bear flag pattern on a candlestick chart. The pattern starts with the declining flagpole, followed by the intervening consolidation period or flag. After the downside breakout occurs, the pattern then completes with a subsequent downward movement of similar magnitude to the flagpole.
Candlestick chart showing a bear flag. Source: IG.com.
Keep in mind that if a bear flag is noted on a chart, and the overall downtrend resumes, the expected price decline once the flag breakout occurs could be very quick. This means that rapidly initiating a short position at the right time after identifying the flag pattern can be essential to trading a bear flag pattern profitably.
How to Identify a Bear Flag Pattern on Forex Charts
Bear flag patterns are fairly easy to identify on forex charts. The diagram below shows a bearish flag pattern occurring on the hourly exchange rate chart for EUR/USD.
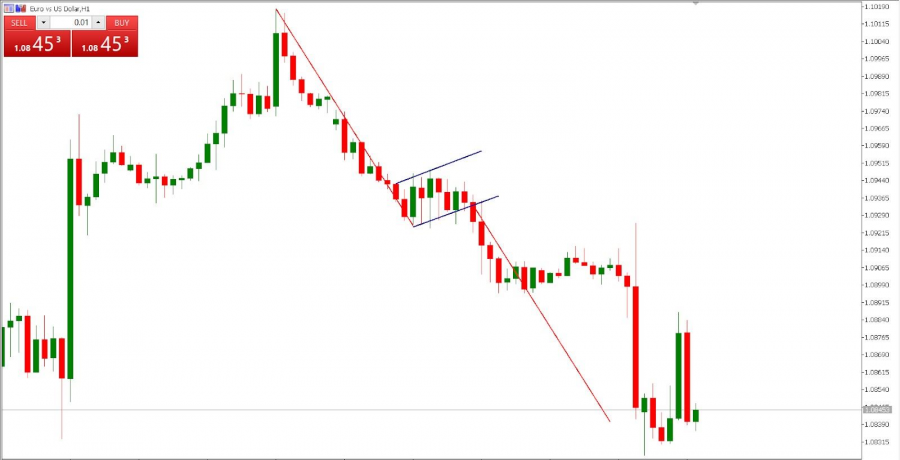
Bear flag appearing on an hourly candlestick chart for EUR/USD. Source: ThinkMarkets.com
In this example, the exchange rate initially falls from around the 1.1000 area in a strong down move to the 1.0900 area to form the flagpole. This creates a target length of 1.1000-1.0900 = 0.0100 for the measured move anticipated after the bear flag’s consolidation phase concludes.
After the flagpole forms, the exchange rate then rises overall in a consolidative manner during the counter-trend flag move, although if the flag had risen more than half of the flagpole, the pattern would have been disregarded. The exchange rate then breaks firmly below the flag’s lower channel line with a red candle that closes below the 1.0936 level.
The take-profit objective for the subsequent decline is computed as the difference between the breakout level and the measured move or 1.0936-0.0100 = 1.0836. Stop losses can then be placed safely above the 1.0936 level and ideally above the top of the flag’s consolidation pattern.
What Does a Bear Flag Pattern Mean?
A bear flag pattern has a clear meaning to a savvy technical trader. The well-known dynamics and reliability of the bear flag pattern allow a trader to establish an objective strategy for profiting from the pattern.
The trader can do this by identifying four key points: entry, stop loss and two possible profit targets. These points are shown on the schematic bear flag diagram below.
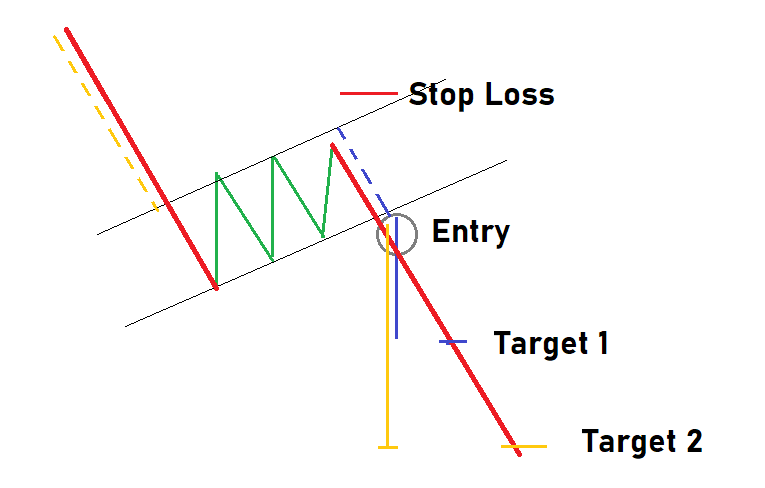
A schematic diagram of a bear flag showing a four-point trading strategy. Source: Learn.ByBit.com
Each of these four points is summarized in the bullet points below:
- Entry Point: Wait for an initial breakout to avoid trading on a false signal. This can be signaled by a closing candle occurring below the lower line of the flag’s channel.
- Stop Loss Point: The level of the flag channel’s upper trend line marks a reasonably safe place to put your stop loss above. In the previous section’s example, the upper trend line of the EUR/USD bear flag channel was around the 1.0950 level when the downside breakout occurred, so 1.0975 could have been a suitable stop-loss level to use when trading that pattern.
- Take Profit Target Point #1: A conservative way to set an initial take profit level would be to measure the difference between the parallel lines of the flag’s channel and then project that difference downwards from the breakout point since that is how technical analysts generally trade channels. In the above example, the upper line of the channel was at 1.0950, while the lower line was at 1.0935. The difference of 15 pips or 0.0015 would then be projected downwards from the 1.0935 breakout level to give an initial profit-taking objective of 1.0920.
- Take Profit Target Point #2: A more traditional way to take profits after a bear flag breakout involves measuring the vertical height of the flagpole and then projecting that downwards from the breakout point. In the preceding example, the flagpole begins at around 1.1000 and ends at around 1.0900 where the corrective flag begins. The height is the difference between those levels or 0.0100. Since the flag’s breakout point was 1.0935, the ideal profit-taking objective would be 1.0935-0.0100 or 1.0835 in that instance.
To optimize their chances for success, traders using the bear flag pattern will additionally want to take into account the prevailing market trend and volume patterns. They will want to use a prudent position sizing method to ensure that they are taking risks suitable for their account size and risk tolerance.
Example of a Bear Flag Trading Strategy
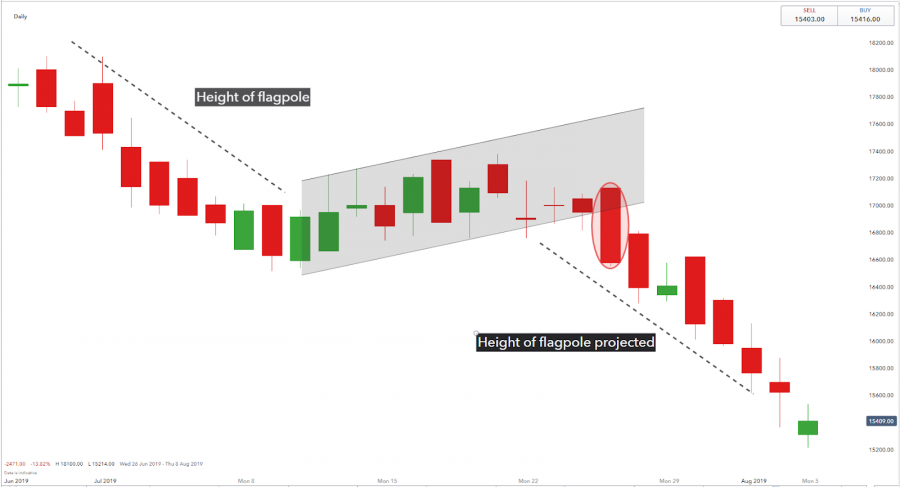
The image below shows a bear flag occurring on an actual candlestick chart. You will note that the text appearing on the image points out the sharply declining flagpole. The height of this flagpole is used for measuring the chart pattern’s final objective.
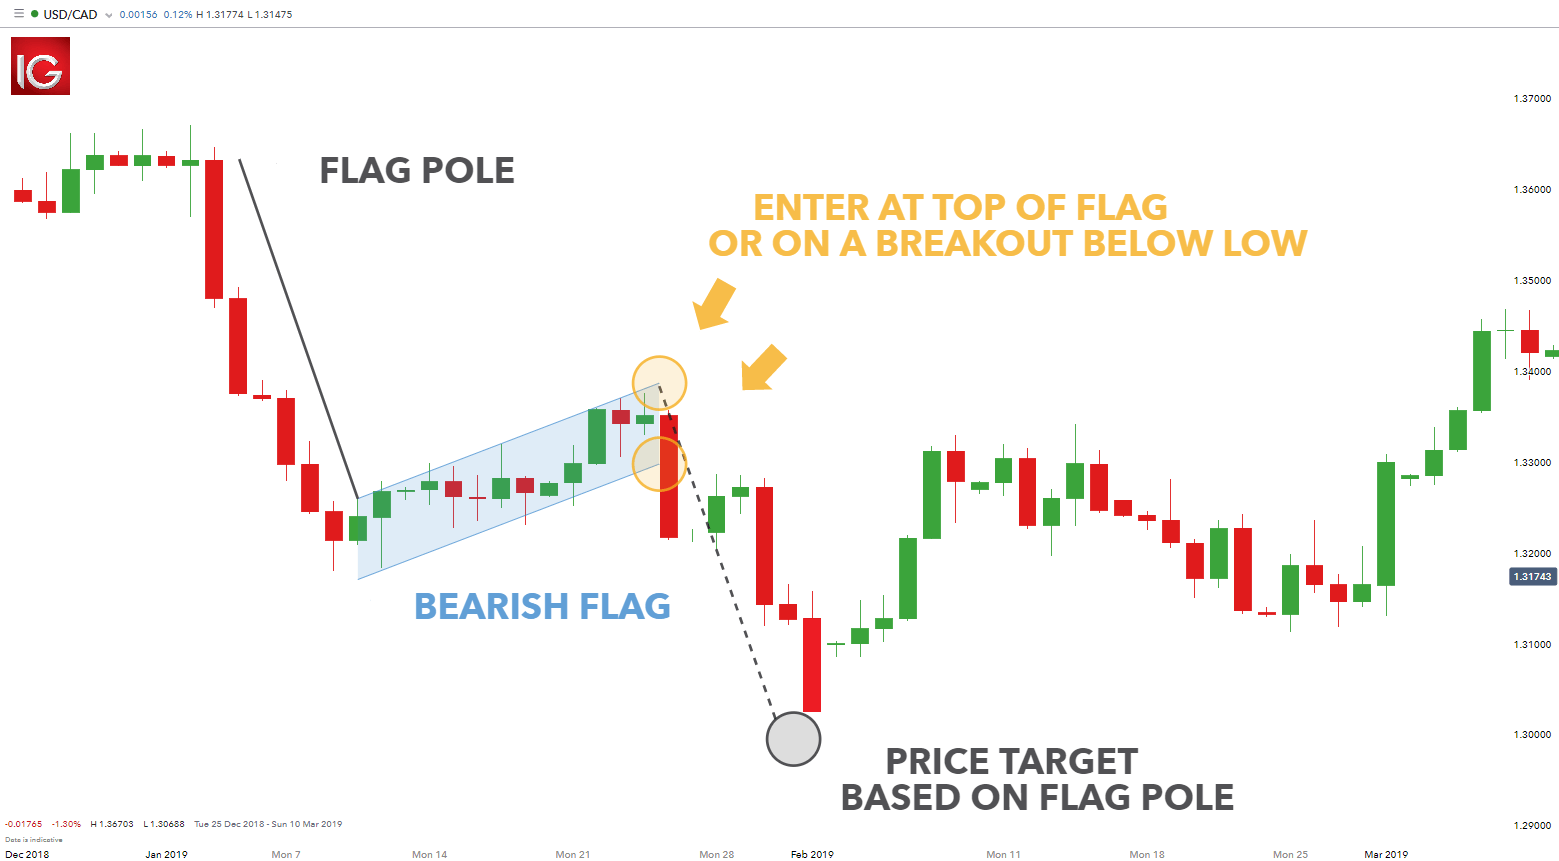
Image of a candlestick chart of USD/CAD showing a bear flag. Source: IG.com
The above image also has the flag’s upward-sloping channel highlighted in a blue shaded color and the downside breakout point encircled in orange for clarity. Finally, it shows how the height of the flag pole is projected downwards from that breakout level to determine the maximum price target for taking profits.
The following example will illustrate in detail how to trade the above-pictured bear flag pattern appearing on a chart of the USD/CAD currency pair’s exchange rate.
The flag pole started in 2019 at the 1.3650 January 3 high and fell sharply to conclude at the January 9 low of 1.3180 for a total length of 0.0470. The subsequent upward flag consolidation channel is highlighted in blue.
The flag pattern becomes increasingly apparent as that upwards channel develops over the latter half of January. Keep in mind that the flag should not exceed a 50% retracement of the preceding flagpole move.
Once the lower rising trendline of the flag’s channel breaks to the downside at around the 1.3300 level in late January, then that sets up the ideal exchange rate target. You can deduct the 0.0470 height of the flag pole from the 1.3300 breakout level to determine the bear flag pattern’s ultimate exchange rate target of 1.2830.
In this example, the bear flag pattern missed its target level by 170 pips in early February 2019 and started rising again from the 1.3000 level. This illustrates both the practical risk of remaining stubbornly attached to a chart pattern’s target level and the importance of psychological support points like the 1.3000 level that can easily frustrate your theoretical technical objectives.
Bear Flag vs. Bull Flag
A bear flag and a bull flag are basically the same chart pattern, but they occur in different market directions. The bear flag occurs as a continuation pattern in a declining or bearish market, while the bull flag also occurs as a continuation pattern but in a rising or bullish market.
The following set of schematic diagrams illustrates the difference between bull and bear flags.
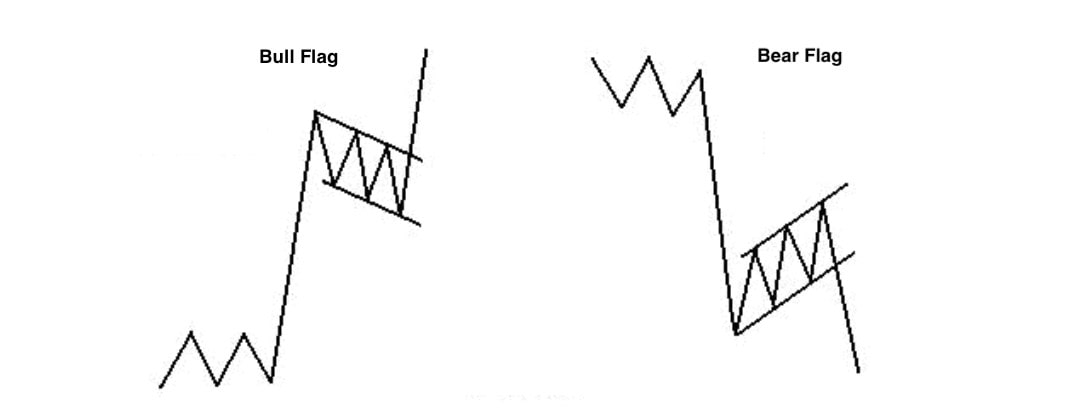
Schematics of a bull flag and a bear flag shown for comparison purposes. Source: Libertex.com
You will note that both of these classic and reliable chart patterns have an initial flagpole and that both have a subsequent consolidation phase or flag that occurs between parallel channel lines. Both also have a concluding breakout in the same direction as the initial flagpole move that suggests take-profit points that are measured to similar extents.
Basically, trading these two classic chart patterns involves taking very similar steps, just on opposite sides of the market.
Using Volume to Confirm a Bear Flag Pattern
Transaction volume is often used by more sophisticated technical analysts to help confirm classic chart patterns like the bear flag since it tends to have a characteristic associated volume pattern.
Volume tends to increase initially during the bearish flagpole’s formation and then decline during the flag consolidation phase. The volume will then typically surge during the breakout and may also rise during the final decline until it starts to wane again near the pattern’s completion point.
Traders observing a potential bear flag formation will therefore typically look for strong volume occurring during the flagpole’s formation. This shows overall bearish sentiment exists in the market.
When the market then starts to consolidate to create the counter-trend flag portion of the pattern, transaction volume should slacken off considerably as the flag forms. This reflects the relatively modest buying interest in the market at and just above the lowest levels that the flagpole’s move achieved.
While volume might actually rise in the flag consolidation phase for stocks due to increased investor anxiety, the volume observed during a flag consolidation phase will typically decline for currency pairs since the psychology driving up and down trends is generally more balanced in the forex market.
Seeing such volume observations in practice can strengthen a technical analyst’s hypothesis that the upcoming market move will be a sharp decline as the suspected bear flag pattern completes its measured move.
Trade Bear Flag Patterns with These Top Brokers
If you are interested in using bear flags and other classic chart patterns to trade the forex market as a retail trader, then you will probably need an online broker to handle your transactions. Benzinga has made that broker selection process easier by compiling a comparison table of some of the best and most reputable online forex brokers for your review.
Claim Exclusive Offers
![]()
get started
securely through FOREX.com’s
website
FOREX.com is a one-stop shop for forex traders. With a massive range of tradable currencies, low account minimums and an impressive trading platform, FOREX.com is an excellent choice for brokers searching for a home base for their currency trading. New traders and seasoned veterans alike will love FOREX.com’s extensive education and research center that provides free, informative forex trading courses at multiple skill levels. While FOREX.com is impressive, remember that it isn’t a standard broker.
Best For
- MetaTrader 4 users
- Beginner forex traders
- Active forex traders
- Impressive, easy-to-navigate platform
- Wide range of education and research tools
- Access to over 80 currencies to buy and sell
- Leverage available up to 50:1
- Cannot buy and sell other securities (like stocks and bonds)
![]()
get started
securely through IG Markets’s
website
IG is a comprehensive forex broker that offers full access to the currency market and support for over 80 currency pairs. The broker only offers forex trading to its U.S.-based customers, the brokerage does it spectacularly well. Novice traders will love IG’s intuitive mobile and desktop platforms, while advanced traders will revel in the platform’s selection of indicators and charting tools. Though IG could work on its customer service and fees, the broker is an asset to new forex traders and those who prefer a more streamlined interface.
Best For
- New forex traders who are still learning the ropes
- Traders who prefer a simple, clean interface
- Forex traders who trade primarily on a tablet
- Easy-to-navigate platform is easy for beginners to master
- Mobile and tablet platforms offer full functionality of the desktop version
- Margin rates are easy to understand and affordable
- Access to over 80 currency pairs
- U.S. traders can currently only trade forex
- Customer service options are lacking
- No 2-factor authentication on mobile

get started
securely through CedarFX’s
website
Billing itself as the world’s 1st eco-friendly broker, CedarFX makes it easy to trade and give back to the planet. You can choose a 0% Commission Account or an Eco Account — or open multiple accounts to meet all your needs.
CedarFX offers access to a wide range of tradable securities, including stocks, futures, major and exotic forex pairs, cryptocurrencies and more. Though CedarFX could introduce a few additional educational resources, the broker remains a unique option for traders invested in giving back.
Best For
- Forex investors
- Investors interested in 0% commission or eco conscious trading
- Investors looking for 24/7 customer service
- Allows users to offset their carbon footprint
- 0% commission investing
- Offers demo account access
- 24/7 customer service available through live chat
- Eco Account Option (10 trees planted for each lot traded)
- Fast deposits/withdrawls with Bitcoin
- Limited number of educational resources for new investors

Get started
securely through AvaTrade’s
website
A fully regulated broker with a presence in Europe, South Africa, the Middle East, British Virgin Islands, Australia and Japan, Avatrade deals with mainly forex and CFDs on stocks, commodities, indexes, forex, cryptocurrencies, etc. This brokerage is headquartered in Dublin, Ireland and began offering its services in 2006. It offers multiple trading platforms and earns mainly through spreads.
Best For
- Beginners
- Advanced traders
- Traders looking for a well-diversified portfolio
- Controlled by regulatory agencies of multiple countries
- Choice offered in terms of trading platforms
- Support available in 14 languages and trading platforms in 20 languages
- Practice/demo account available for trying out
- Breadth of trading assets
- Does not accept customers from the U.S. as it isn’t regulated in the U.S.
- Transferring funds to the account may take up to five days; withdrawals could take up to 10 days
![]()
Get started
securely through Pepperstone’s
website
Pepperstone is an Australian broker focused on providing international forex, CFD and cryptocurrency trading. Though U.S. traders currently cannot open an account with Pepperstone, the broker remains an affordable and comprehensive option for international traders.
Pepperstone offers traders access to over 61 forex markets, over 60 CFDs for index funds and stocks and 5 cryptocurrencies. Leverage options with Pepperstone are extensive; you may qualify for up to 500:1 leverage when trading currencies and up to 5:1 leverage when trading cryptocurrencies, for example.
There are a few areas where Pepperstone can afford to improve. We’d love to see Pepperstone add its own trading platform in the future instead of relying entirely on 3rd-party platforms. We’d also love to see direct stock and fund purchase options in the future. Despite these flaws, Pepperstone remains a very strong choice for international traders.
Best For
- International traders interested in trading CFDs from foreign markets and currencies
- Traders who are already familiar with the MetaTrader or cTrader platforms
- Traders who are looking for leverage when trading cryptocurrencies
- Access to over 61 forex pairs and over 60 stock CFDs
- Leverage available for both forex and cryptocurrency trading
- Wide range of educational tools and courses that both beginners and experts can use
- 24/7 customer service
- Not currently available to U.S. traders
- No option to purchase stocks, bonds or mutual funds directly; only CFDs are available

get started
securely through SimpleFX’s
website
SimpleFX is a cutting-edge online trading app, allowing you to invest fiat money or cryptocurrency in forex, crypto, indices, precious metals and commodities. With the WebTrader, you can learn to invest online and unlock advanced features designed for your success.
Best For
- Traders who need lots of options
- Customers who wish to invest with leverage
- Multicurrency traders
- Cryptocurrency owners who would like to invest with them
- Traders who prefer to skip the KYC and sign up just with an email address
- Experienced traders who would like to use MT4
- Simple to manage
- 60 currency pairs
- Spreads as low as 0.1
- Trading never closes
- Stock trading
- No minimum deposit
- No KYC for cryptocurrency accounts
- On the market since 2014
- Almost too many options for new investors
- Not yet available to U.S. users
Frequently Asked Questions
Is a bear flag bullish or bearish?
As the name implies, a bear flag is considered a bearish chart pattern.
Answer Link
Can a bear flag be bullish?
Generally no since a bear flag is a bearish chart pattern that suggests a downtrend will continue.
Answer Link
How reliable are bear flags?
While no chart pattern is infallible, bear flags are one of the more reliable chart patterns, although if the retracement or “flag” extends beyond 50% of the pole, the pattern should be disregarded as failed.
Answer Link
The post Learning to Trade a Bear Flag Pattern by Jay and Julie Hawk appeared first on Benzinga. Visit Benzinga to get more great content like this.