The post How to Trade Forex Wedge Patterns by Jay and Julie Hawk appeared first on Benzinga. Visit Benzinga to get more great content like this.
Trade forex wedge patterns today with CedarFX as your forex broker.
Forex traders often use chart patterns to obtain strategic insights to help guide their currency trading activities. Among the array of available chart patterns used in technical analysis, the wedge pattern stands out as a reasonably reliable tool for predicting potential exchange rate or price movement activity.
In this comprehensive guide to trading wedge patterns, Benzinga aims to equip forex traders with a robust understanding of how to go about trading forex wedge patterns.
The article will cover essential aspects of the wedge pattern, such as its key characteristics and market implications, common technical analysis techniques using the wedge, effective trading strategies centered on identifying wedge patterns and the use of them to provide potentially profitable forex trade signals.
Table of contents
[Show]
Understanding Wedge Patterns
Narrowing or converging wedge patterns in forex trading are chart formations that occur when two trendlines that move in the same direction converge to create a gradually reduced exchange rate range. They are typically characterized as rising or ascending and falling or descending wedges. Several broadening wedge patterns also exist that have diverging trend lines and can provide useful additional information and signals for forex traders to act upon.
Wedge patterns are particularly interesting because they can indicate both potential reversals and continuations in exchange rate trends depending on the exchange rate or price action context in which they appear.
In general, if a rising or falling converging wedge pattern moves against the prevailing trend, it serves as a continuation pattern, while if the wedge moves with the trend, it acts as a reversal signal. In either case, narrowing wedge patterns signal an overall loss of momentum in the direction that the wedge moves in and a coincident decline in market volatility.
Traders using wedge patterns need to accurately draw each upper and lower trendline of these patterns through the notable swing highs and lows that the market made during the pattern’s lifetime. They should also look for at least three touches of the developing pattern’s upper and lower trend lines to confirm a wedge pattern exists.
Finally, it makes sense for forex traders to identify key support and resistance levels within each wedge pattern and look for additional confirmation of pattern breakouts to obtain the best trading results from their chart pattern analysis. Once a breakout occurs, the typically measured move of a wedge pattern is determined by projecting the initial width of the wedge from its breakout point.
Falling Wedge
The declining, descending or falling wedge is a bullish chart pattern that can occur in either a downtrend or an uptrend. It is characterized by two converging upper and lower trendlines where each trend line displays a downward slope. Despite its declining nature, the falling wedge generally breaks to the upside as shown in the image below.
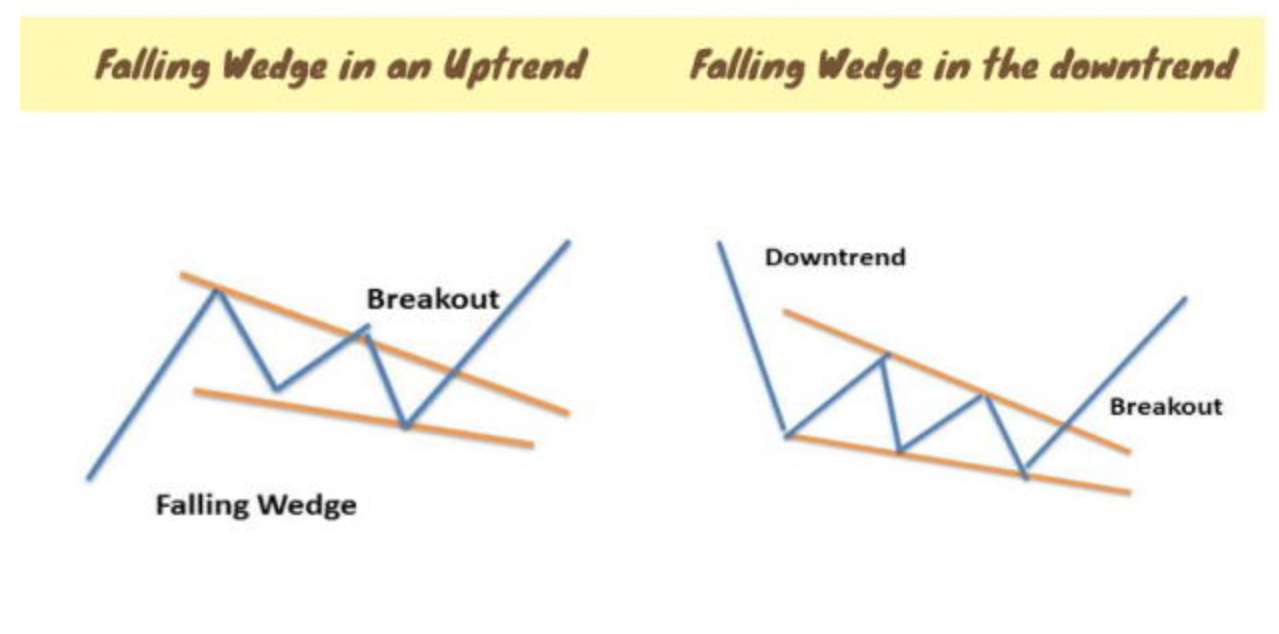
Schematic diagrams of the falling wedge as either a continuation or reversal pattern. Source: eLearnMarkets
When the falling wedge occurs in a downtrend, it is often considered a bullish reversal pattern that indicates a gradual loss of downward market momentum. Seeing the falling wedge appear on an exchange rate chart after a decline thus suggests that the forex market might be preparing itself for an upward breakout, as indicated by higher lows and a contracting exchange rate trading range.
If a falling wedge is seen after a market rise, however, it serves as a continuation pattern that indicates corrective market activity to the downside is waning. A breakout to the upside to continue the rising trend would thus be reasonably anticipated.
Forex traders should exercise caution and wait for a confirmed breakout above the falling wedge pattern’s declining upper resistance line before making a trading decision to go long based on the appearance of this pattern on an exchange rate chart since the falling wedge can also sometimes break out to the downside.
Rising Wedge
The ascending or rising converving wedge pattern is similar to the falling converging wedge but is instead bounded by two converging trendlines with an upward slope. No matter whether it arises after an uptrend or downtrend, it is generally viewed as a bearish chart pattern that can signal either a continuation or reversal of the preceding trend as shown in the image below. 
Schematic diagrams of the rising wedge as either a reversal or continuation pattern. Source: eLearnMarkets
The rising converging wedge is characterized by a series of higher highs and higher lows, as well as by a narrowing exchange rate range that reflects reducing volatility levels over time as it progresses. Although the rising wedge shows an overall pattern of increasing exchange rates, it generally signals the potential for a downward breakout since upside market momentum is waning along with volatility.
Forex traders should monitor the apex of the two rising trendlines closely and watch for a confirmed pattern breakout to the downside by consulting other technical indicators before considering acting on any trading opportunities based on this chart pattern.
Broadening Wedge
Broadening wedges are also known as megaphone patterns since they look like a megaphone tilted upwards or downwards. Like with the narrowing wedge patterns previously discussed, both trendlines of a broadening wedge slope in the same direction, although they diverge in the megaphone pattern.
With rising broadening wedges, the top trendline slopes more steeply than the bottom one, while in falling broadening wedges the lower trendlines fall more rapidly than the upper one. Also, a minimum of three peaks and troughs should touch each trendline.
Unlike the narrowing wedge patterns, broadening wedges exhibit expanding exchange rate ranges over time that reflect increasing market volatility. The appearance of this structure thus suggests an overall increase in market activity as the pattern progresses.

Schematic diagrams of ascending and descending broadening wedges. Source: Oreilly.com
As the above diagrams illustrate, rising megaphones are usually seen in a bull market and are followed by a downside breakout, while falling megaphones tend to appear in declining markets and break out to the upside.
Interpreting broadening wedges involves understanding that the expanding range signifies a divergence in market opinions. This duality presents both bullish and bearish scenarios, adding complexity to traders’ decision-making when using this pattern, so waiting for a breakout is essential before trading based on this pattern.
Analyzing Wedge Patterns
An effective technical analysis of the various wedge patterns involves considering several factors. In addition to identifying a pattern that conforms to the general shape of a wedge and seeing at least three touches of its upper and lower trendlines, factors like trading volume, market momentum, volatility and market context often play a key role in confirming the validity of these chart patterns.
For example, an increase in trading volume during a breakout from a wedge pattern typically lends credibility to the pattern’s potential to signal that a significant market move is underway in the direction of the breakout. Breakouts occurring on low volume tend to be reversed promptly, so traders should avoid trading on them.
Market momentum should generally increase on a breakout from a wedge pattern. This means that the careful use of technical indicators that reflect market momentum, such as the Relative Strength Index (RSI) and the Moving Average Convergence Divergence (MACD) oscillator, can provide further confirmation of trading signals derived from wedge patterns.
Identifying optimal trade entry and exit points to take advantage of a wedge pattern generally requires taking a strategic analytical approach. Astute forex traders using wedge patterns will often wait for a confirmed breakout above or below the pattern’s converging trendlines before executing a forex trade in the direction of the breakout based on this pattern.
Note that a wedge pattern’s breakout point is where the exchange rate’s movement is likely to be the strongest and sharpest. Watching the market closely for this event can offer traders a favorable risk-to-reward ratio if they can get into the market promptly. If the breakout move happens too quickly to react effectively, traders can wait for a pullback to the region of the breakout point to get into the market.
Trading Strategies for Wedge Patterns
Several trading strategies can be used when trading forex based on wedge patterns. These include the following.
Trading Strategy 1: Breakout Confirmation
This strategy involves waiting for a confirmed breakout beyond one of the trendlines. Traders enter the market once the exchange rate’s movement validates the pattern’s direction, which can lead to significant trading opportunities.
Trading Strategy 2: Indicator Alignment
In this strategy, trading volume and technical momentum indicators such as RSI and MACD are used to validate the wedge pattern’s trading signals. When these indicators align with the pattern’s direction, traders can gain more confidence in their trading decisions.
Trading Strategy 3: Watching for Convergence
In this strategy, traders identify the convergence or apex of the two trendlines identified within a wedge pattern. The convergence serves as a signal, prompting traders to prepare for a potential breakout. Once the breakout occurs, traders can execute their trades with calculated precision to profit from the anticipated market reversal that a wedge pattern indicates.
Real-Life Examples of Wedge Chart Patterns
Consider a theoretical example of trading a wedge chart pattern involving the EUR/USD currency pair. If a forex trader observes a rising converging wedge pattern forming on the exchange rate chart for EUR/USD, they will first draw the rising converging trendlines that characterize this pattern while also making sure that each trendline is touched at least three times.
The trader now watches the market carefully as the apex of the wedge approaches. Once the trader observes a bearish breakout below the rising wedge’s lower trendline, they look to confirm that the breakout occurred on a rise in trading volume. They also seek additional confirmation by observing rising momentum on the RSI and MACD indicators for EUR/USD.
Given that all factors currently look favorable for a significant exchange rate decline, the trader aims to take a position to align with the bearish breakout by selling EUR/USD short. They initially look to sell just below the wedge’s broken lower trendline, while placing their stop-loss order safely above the upper trendline of the rising wedge.
They also calculate the initial width of the wedge and project that amount downwards from the breakout point to determine an objective. They then place their take-profit buy order just above that target level and watch it carefully, possibly adjusting their stop-loss order higher as profits accrue on the trade.
Real-Life Falling Wedge Example in EUR/USD
Now consider the following real-life example of a declining wedge chart pattern appearing on the exchange rate chart for EUR/USD. As the chart below shows, EUR/USD had been trending lower on the 15-minute chart, but waning downside market momentum eventually prompted the development of a falling wedge pattern.
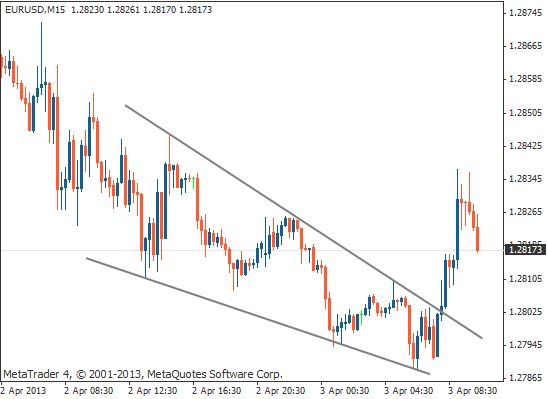
EUR/USD exchange rate chart showing a declining wedge and breakout. Source: Tradimo.
This reversal pattern evolved nicely between two declining and converging trendlines, touching each one three times, until the market eventually gathered enough momentum to break out of the pattern to the upside before the apex of the pattern was reached.
The ensuing sharp upward move then progressed higher to attain a level roughly equal to the initial width of the wedge pattern projected upwards from the breakout point before coming off again.
Real-Life Falling Wedge Example in USD/JPY
Another scenario involving a declining wedge appears in the USD/JPY hourly chart shown below. In this case, the bullish pattern occurs after an upward trend in the currency pair and thus serves as a continuation pattern.
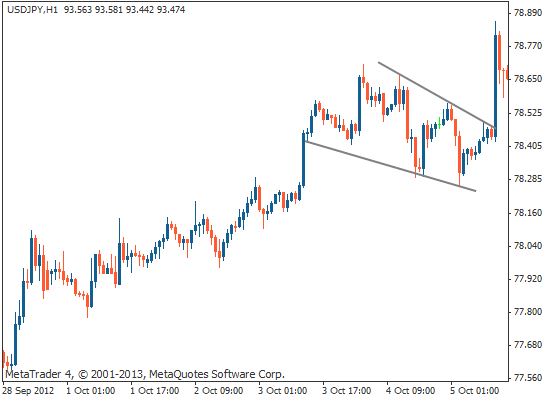
USD/JPY exchange rate chart showing a declining wedge and breakout. Source: Tradimo.
The wedge’s upside breakout signals that the prevailing uptrend is likely to continue after the corrective decline seen during the duration of the falling wedge’s formation. As in the previous example, the wedge’s sharp breakout move travels roughly the distance of the wedge’s initial width before correcting somewhat thereby giving an observant trader ample opportunity to profit from this move.
Can Forex Traders Benefit from Using Wedge Patterns?
Forex traders can definitely take advantage of rising and falling wedge patterns in their technical analysis since such reversal patterns offer observant traders a systematic approach to interpreting and anticipating potential market movements that can result in profitable trades.
By using wedge patterns in combination with other technical analysis methods and confirmation indicators and by setting their trade entry and exit points strategically, traders can use the various wedge patterns to enhance their decision-making process and potentially capitalize on readily identifiable trading opportunities.
When using wedge patterns in your forex trading strategy, remember to use sensible risk management techniques like placing stop-loss orders, employing prudent money management methods to size your positions appropriately to protect your trading capital and using trailing stops to protect accrued profits in case of a sharp and unanticipated market correction.
Frequently Asked Questions
Is a wedge bullish or bearish?
A wedge pattern’s bullish or bearish nature depends on its specific type and the market context in which it appears. Falling wedges are typically bullish and suggest potential upward moves while rising wedges are often bearish and indicate potential downward moves are forthcoming.
Answer Link
What are patterns in forex?
Patterns in forex refer to recurring formations that appear on exchange rate charts and offer insights into potential future currency market movements. These chart patterns help forex traders anticipate market behavior so that they can use that valuable information in their trading strategy.
Answer Link
Which forex pairs trend the most?
Major currency pairs such as EUR/USD, GBP/USD and USD/JPY tend to exhibit moderately consistent trends over time because of their high liquidity and global economic significance, although less-traded pairs like AUD/USD and NZD/USD can show more extensive trending moves. Also, certain cross-currency pairs like AUD/JPY, GBP/JPY and EUR/JPY can show prolonged trends that typically arise from the existence of sustained interest rate differentials between the two currencies involved.
Answer Link
Disclosure: Benzinga was commissioned for this article and is not affiliated with CedarFX. Any comments or opinions provided herein are Benzinga’s. CedarFX does not endorse or promote any trading strategies that may be discussed or promoted herein. The broker makes no representation or warranty as to the article’s adequacy, completeness, accuracy or timeliness for any particular purpose of the above content.
This presentation discusses technical analysis, other approaches, including fundamental analysis, may offer very different views. The examples provided are for illustrative purposes only and are not intended to be reflective of the results you can expect to achieve. This article is for informational and educational use only and is not a recommendation or endorsement of any particular investment or investment strategy. Investment information provided in this content is general in nature, strictly for illustrative purposes, and may not be appropriate for all investors. Investing involves risk regardless of the strategy selected and past performance does not indicate or guarantee future results. Trading leveraged products such as Forex and Cryptos may not be suitable for all investors as they carry a degree of risk to your capital.
The post How to Trade Forex Wedge Patterns by Jay and Julie Hawk appeared first on Benzinga. Visit Benzinga to get more great content like this.