The post How to Read Income Statement Format by Anna Yen appeared first on Benzinga. Visit Benzinga to get more great content like this.
The financial health of a company is critical to its success. An income statement is one of the most important financial documents produced to better understand how a company is doing. Knowing how to read and analyze the income statement format helps you see how a company performs.
Table of contents
[Show]
What is an Income Statement?
An income statement is a summary of a company’s operational activities. By comparing the revenue earned and expenses paid out, an income statement shows whether a company has made a profit or suffered a loss. An income statement focuses on the revenues, expenses, gains and losses the company experiences over a specific period, such as by month or year.
Key Components of an Income Statement
An income statement has three critical components.
- Revenue: Money a company earns from sales of goods or services.
- Expenses: Amount of money the company spends to run its operations. Spending includes the direct cost paid by a company to make its products or deliver services and the general, administrative and selling expenses incurred for its operations. A company may also incur non-operating costs, such as interest, depreciation and taxes.
- Net income: Net income is a company’s overall profit or loss. Net income is calculated by subtracting the company’s expenses from its revenues.
What’s the Importance of Knowing How to Read an Income Statement?
An income statement provides insight into a company’s profitability. Business owners, investors and stock traders can use the income statement to better understand how the company generates revenue, ordinary expenses incurred and how profitable it is.
When you know how to read an income statement, you can compare a company’s operating results against industry benchmarks to see how it matches up against the competition. You can also gauge how much the company has grown and how well it operates by comparing its year-over-year performance.
How to Read an Income Statement
Knowing how to read an income statement offers valuable insight into the company’s operations, efficiency and performance.
Analyzing Revenue
Depending on the company’s operations, the income statement can break down sales into different revenue streams, such as product sales, services, rental income and other sources of revenue. The revenue line items are categorized depending on the type of business. For example, sales generated in a bakery may be broken down into categories as baked goods, coffee and beverage sales and products, such as mugs or coffee beans.
The income statement can help owners and investors identify trends and compare revenue generated from different offerings. Comparing the total revenue generated in the current year against prior year activity shows whether a company’s sales have grown or contracted.
Understanding Expenses
The expenses a company incurs reduce its profit. An income statement provides a summary of costs incurred by a company. The key categories of expense are broken down into:
- Cost of goods sold: A company’s cost of goods sold (COGS) is the direct costs incurred to produce revenue. COGS varies by company. Your company’s COGS may include what you paid for the products you sell, costs you incur to manufacture a product or what you paid employees to provide a service.
- Operating expenses: Costs paid to run your company. Operating expenses include rent, insurance, utilities and office supplies.
- Interest expense: The company’s cost of borrowing money. Whether your company has an equipment loan or a mortgage on a building, a portion of your monthly payment is the interest paid on what you owe.
- Tax: Depending on your company’s legal structure, you may incur income tax expenses on your profits.
Gross and Operating Margins
The gross margin shows how much profit a company makes on every dollar spent toward selling its products or services. To calculate a company’s gross margin, you first calculate its gross profit as follows:
Revenue – Cost of Goods Sold (COGS) = Gross Profit
The gross margin is calculated as the company’s gross profit divided by its revenue:
Gross Profit / Revenue
Gross margin reveals how efficiently a company makes a profit. The higher the margin, the better the company manages its direct costs. The gross margin also shows, as a percentage, how much profit remains to cover a company’s operating, interest and tax expenses.
The company’s operating margin can indicate how well a company manages the profits from its sales. To calculate your operating margin, you first need to determine the company’s operating income as follows:
Revenue – Cost of Goods Sold (COGS) – Operating Expenses = Earnings from Operations
To calculate your company’s operating margin, you divide the earnings from operations by the company’s total revenue:
Earnings from Operations / Revenue
The operating margin reveals, as a percentage, how much earnings from operations a company generates on every $1 of sales. The higher the margin, the more profit the company keeps. The operating margin also shows how much profit is available to pay interest and income tax.
Analyzing Net Income
Net income represents the profit earned by a company. You calculate net income by taking the total sales and subtracting all expenses incurred by the company, including cost of goods sold, operating expenses, interest, depreciation and taxes. When the result is positive, the company has generated net income for the year. However, the company has incurred a net loss if the calculation yields a negative number.
Net income is a vital indicator of a company’s profitability. While revenue shows how effectively a company generates sales, net income reveals how efficiently a company manages its costs.
Net income is helpful for owners, bankers and investors to see how profitable a company is. However, comparing net income against industry benchmarks can show how efficiently a company manages its resources against competitors.
Additional Metrics and Ratios
Additional metrics and ratios can be helpful when evaluating a company’s performance. Many of these formulas rely on information found on the company’s balance sheet, such as total assets and shareholder equity.
The Return on Asset (ROA) ratio shows how effectively a company converts its investment into profit. Higher ratios indicate the company earns more money with less investment.
The ROA formula is expressed as:
Net Income / Total Assets
The Return on Equity (ROE) ratio measures the company’s profitability against shareholder equity. ROE gives an indication as to how productively the company spends money.
Return on equity is calculated as:
Net income / Average shareholder equity
Example of an Income Statement Format
An income statement shows a company’s revenue and expenses over a specific period. The statement starts at the top with the revenue earned by the company’s operations. It works its way down to the ending profit or loss. Let’s look at a sample income statement to better illustrate the format.
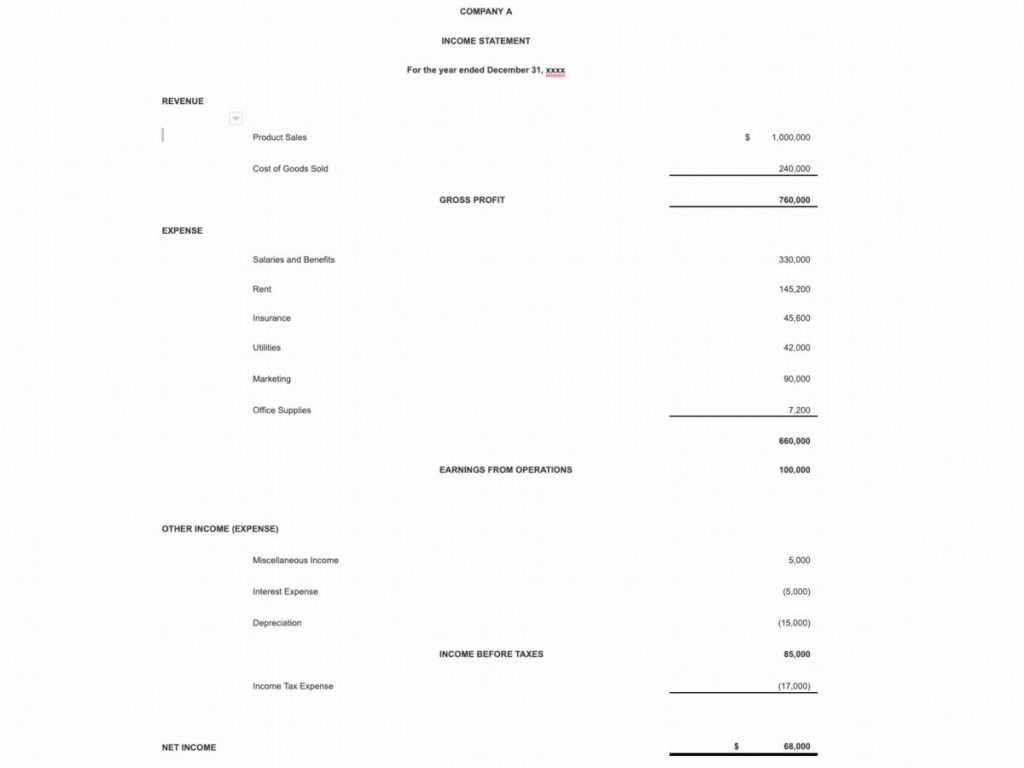
In the example above, Company A has generated $1 million in product sales for the year. After paying $240,000 in product costs, the company’s gross profit is $760,000.
The company’s gross profit margin is 76% ($760,000 / $1,000,000). The company has $.76 remaining for its operating costs for every dollar generated in sales.
The statement then presents operating expenses incurred by the company totaling $660,000. After subtracting operational expenses from gross profit, the company is left with $100,000 in earnings from operations.
Comparing the operational earnings of $100,000 against total sales of $1 million reveals an operating margin of 10%. Based on this calculation, the company has 10% of the revenue earned to use toward non-operating expenses, such as interest, depreciation and income taxes. Once these items are deducted, the company ends the period with a net income of $68,000.
Read a Company’s Income Statement Before You Invest
A company’s income statement gives owners, investors and stock traders a deeper understanding of its operational results. In addition, a company can use its income statement to identify growth areas or opportunities to cut expenses. Using ratio analysis, owners, investors and traders have a benchmark to gauge a company’s value and efficiency.
Frequently Asked Questions
What are the 4 parts of an income statement?
The four parts of an income statement include revenues, expenses, gains and losses and net income.
Answer Link
What is the GAAP income statement?
A GAAP income statement is a financial report prepared in accordance with generally accepted accounting principles. Companies follow GAAP when preparing their financial statements.
Answer Link
How do you interpret income statements and balance sheets?
The balance sheet shows the book value of a company as of a specific date, including its assets, liabilities and equity. The income statement summarizes the revenue and expense activity of a company for a given period, typically a month, quarter or year.
Answer Link
The post How to Read Income Statement Format by Anna Yen appeared first on Benzinga. Visit Benzinga to get more great content like this.