The post Forex Candlestick Patterns Cheat Sheet by Sam Boughedda, Stock Market Analyst appeared first on Benzinga. Visit Benzinga to get more great content like this.
Candlestick patterns are an effective way to help forex traders read currency charts. Benzinga compiled this forex candlestick patterns cheat sheet to help you learn what candlestick patterns you can use in a bearish and bullish currency market.
Earn cash back on your FX trades
Open an account in as little as 5 minutes. Spot opportunities, trade and manage your positions from a full suite of mobile and tablet apps.
Table of contents
[Show]
What is a Candlestick?
Candlestick charts originated in Japan as an informative and compact way to track market prices visually. They later became popular worldwide since they show reliable candle pattern types that traders can incorporate into their trading strategies.
A candlestick chart shows how the value of a stock, currency pair or security evolves over time. Such a chart consists of a series of individual candlesticks that represent the high, low, opening and closing values observed over a certain period of time. These charts also display a variety of common candlestick patterns that forex traders can use to their advantage.
Technical traders might use candlestick charts computed for one or multiple timeframes, such as 15-minute charts, 1-hour charts or daily charts, to name a few. Check out the detailed candlestick patterns cheat sheet below for more information on forex candlestick patterns and how to use them.
Reading Currency Charts with Candlestick Patterns
A candlestick consists of a body and two wicks. The upper and lower wicks on each end of a candlestick’s body respectively represent the currency pair’s highest and lowest exchange rates observed during the candlestick’s time period.
The body of a candlestick is bounded by the opening and closing exchange rates for the relevant time frame. The body is assigned one of two colors, depending on whether the market closed that time period higher or lower than it opened.
If the exchange rate at the close of a given time frame is higher than at the open, then the candle’s body for that time frame will typically be green or white by default, although a user can usually adjust the colors in their technical analysis software. Conversely, if the exchange rate closes below its open for a time frame, the candle will typically be red or black by default.
Candlestick charts provide a visual tool to help traders get a feel for the forex market and identify various candle shapes or multi-candle patterns that have predictive value. You can use candlestick charts to identify a trending market and to trade based on the appearance of reliable candlestick patterns.
A forex cheat sheet containing the most useful bearish and bullish candlestick patterns for currency traders appears in the sections below. You can use this cheat sheet as a reference when looking to incorporate candlestick charts into your trading plan.
6 Bearish Forex Candlestick Patterns
While various chart types can be used by technical forex traders, candlestick charts are among the most popular since a variety of bullish and bearish candlestick patterns can show up on these charts that can suggest profitable trades.
Shooting Star
A shooting star is a bearish reversal candlestick pattern that indicates a decline is likely following an upward trend. As the schematic image above shows, the exchange rate initially rises as buyers enter the market. However, the rate then falls back toward its open price as its upward momentum fails.
A shooting star should have an upper wick at least twice the size of its body with only a small lower wick. This candlestick pattern suggests that a bullish run has reached its high, so a reversal could be in process. The bearish signal may fail, however, if the exchange rate subsequently continues to make gains.
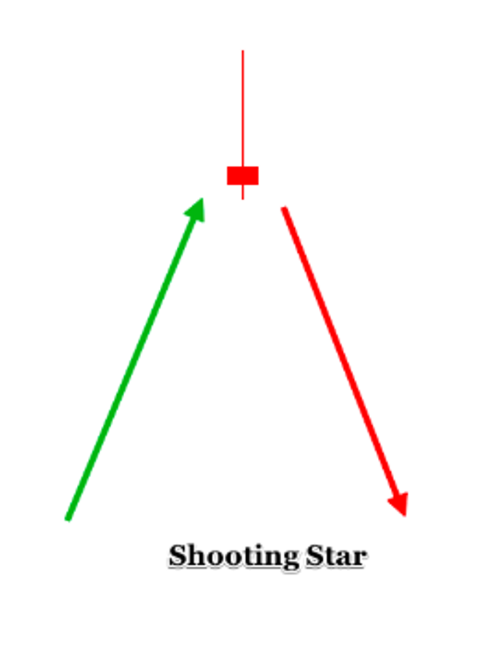
A shooting star candlestick. Source: Benzinga.com.
Evening Star
An evening star is a relatively rare but reliable candlestick pattern that appears during uptrends and signals a bearish reversal. The relatively complex pattern consists of three candles.
In the first candle, a currency pair’s exchange rate rises significantly. The opening of the subsequent small bullish or bearish candle then gaps up. The exchange rate then gaps down to form a bigger bearish candle. The final candle should cover a minimum of half the first candle’s body size.
These signs confirm that an evening star pattern has appeared on the candlestick chart and that a potentially stronger trend reversal to the downside is brewing.
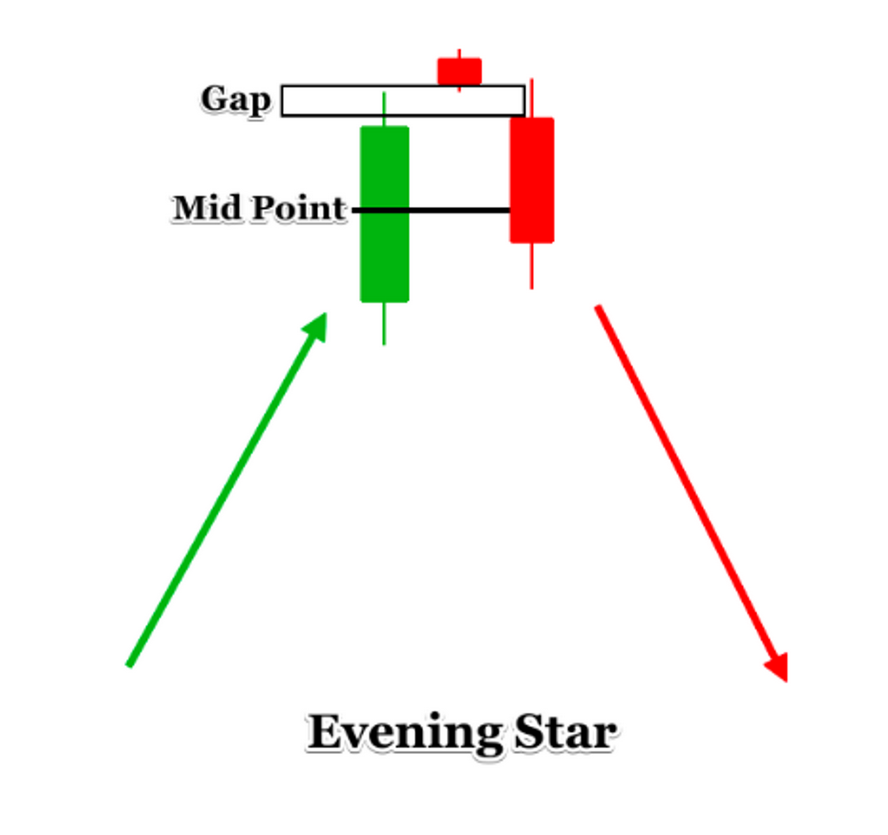
An evening star candlestick pattern. Source: Benzinga.com.
Hanging Man
A hanging man candle is a bearish reversal chart pattern that displays a long lower wick and a small body above it. The hanging man pattern appears during upward trends as they are losing steam and suggests that a downside correction may be imminent.
The appearance of this candle indicates that an increasing number of bearish forex traders are entering the market and attempting to push the exchange rate lower. Although bullish traders force a close higher during this candle’s duration, a bearish reversal may subsequently take place.
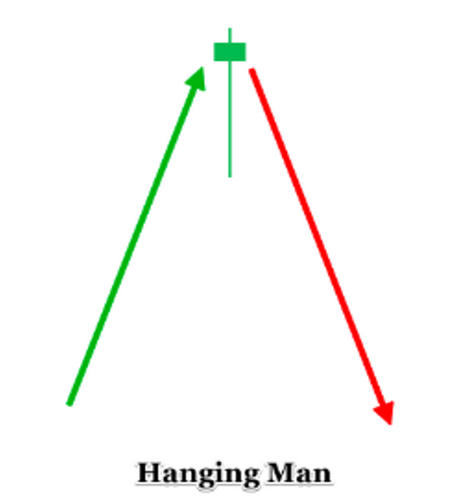
A hanging man candlestick. Source: Benzinga.com.
Bearish Engulfing
A bearish engulfing pattern is a chart pattern that shows up during bullish trends and signals that a trend reversal is on the horizon. In a bearish engulfing pattern, the exchange rate closes higher in the first candle, but it then falls in the second candle to a degree that encompasses, or engulfs, the full extent of the first candle. The bearish engulfing pattern can be a helpful reversal indicator that suggests an aggressive move to the downside is on the horizon, although it is less reliable in choppy markets.
A bearish dark cloud candlestick pattern. Source: Finance.Eyehunts.com.

A bearish engulfing candlestick pattern. Source: Benzinga.com.
Dark Cloud
A dark cloud is a bearish reversal chart pattern consisting of two candlesticks. It forms when the market initially gaps up to open a candle above the previous bullish candle’s close, but the market then ultimately closes below the midpoint or 50% mark of the first candle to form a bearish second candle.
A dark cloud pattern shows that a substantial shift in market momentum from the upside to the downside has taken place. Both the initial bullish and the final bearish candles can be quite large, suggesting a significant number of market participants were involved.
More conservative traders might look for confirmation by waiting for another bearish candle to appear after the dark cloud pattern to signal a selling opportunity.
Three Black Crows
The bearish three black crows chart pattern is a reversal pattern that typically shows up at the end of an uptrend. It consists of three candlesticks that all close lower than the previous candle. This candlestick chart pattern implies strong downside momentum and can be used alongside other technical indicators.

A three black crows candlestick pattern. Source: DStockMarket.com
6 Bullish Forex Candlestick Patterns
While various bearish candlestick patterns are used, traders also rely on many bullish patterns as well.
Bullish Engulfing
The opposite of the bearish engulfing pattern, the bullish engulfing pattern is a two-candle pattern that starts out with a bearish red candle and completes with a bullish green candle that engulfs the previous red candle. This bullish pattern typically shows up after a market decline to suggest a potentially aggressive upside move may be on the horizon.
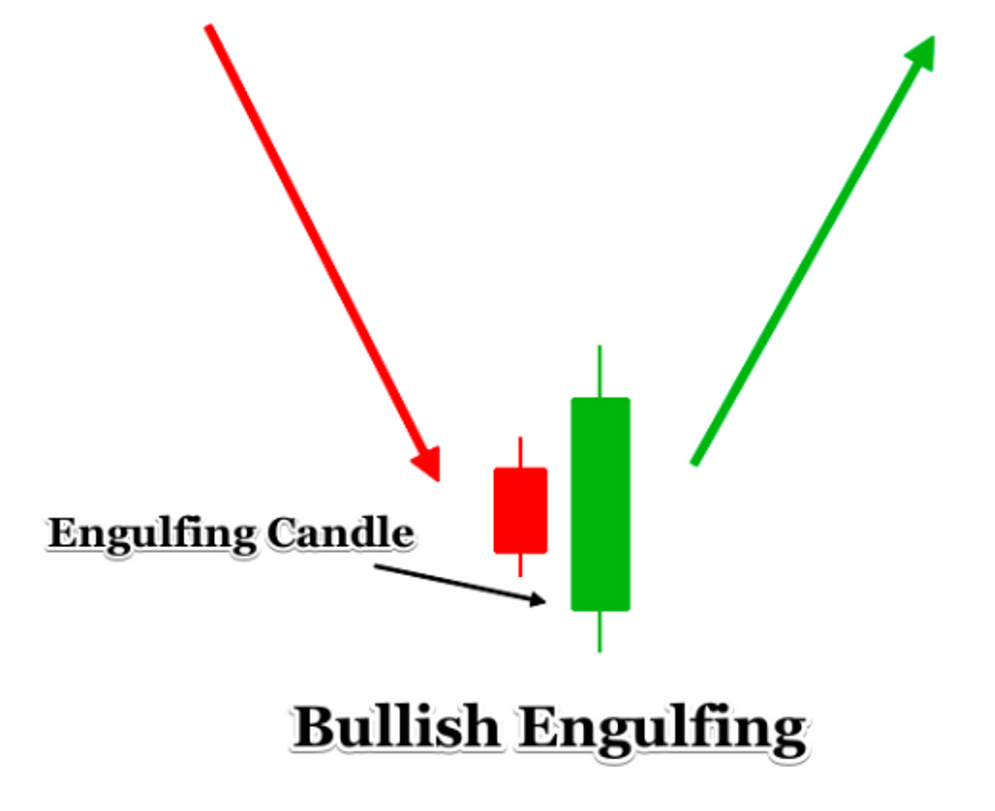
A bullish engulfing candlestick pattern. Source: Benzinga.com.
Hammer
A hammer is a bullish single candle signal of the conclusion of a downward trend and the possibility of a turnaround to the upside. A hammer pattern occurs when a currency pair drops noticeably lower but then spikes higher within the time frame of a single candle. As a result, the candle appears like a hammer since the lower wick is much larger than the actual body.
For a hammer to emerge, sellers cause the exchange rate to decline. However, buyers then absorb the selling pressure and push the exchange rate back up to close just above its opening price. The hammer formation thus indicates potential upside gains for bullish traders.
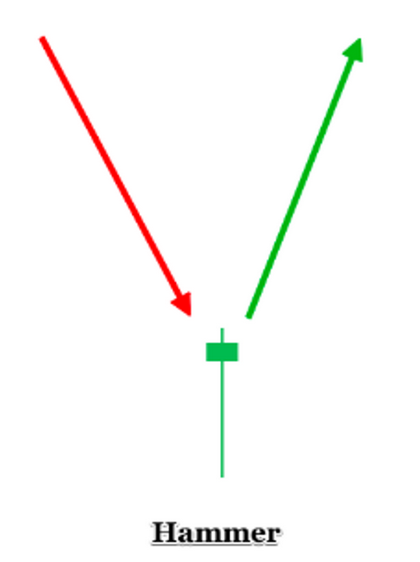
A hammer candlestick. Source: Benzinga.com.
Inverted Hammer
An inverted hammer is a type of bullish single candle that occurs on a candlestick chart after buyers begin putting upward pressure on a currency pair. It tends to have a large upper wick, a short lower wick and a small body. The name comes from the shape of the candle since it looks like an upside-down hammer.
An inverted hammer candle is most commonly seen at the bottom of a downtrend where it signals the start of an upside reversal. Bullish traders begin to gain some confidence and attempt to push the exchange rate higher. Although this attempt may be unsuccessful initially, the inverted hammer candle signals that bullish pressure is emerging.

An inverted hammer candlestick. Source: Benzinga.com.
Morning Star
The morning star pattern consists of three candles that signal the formation of a bullish trend after a downtrend. After the first candle falls, the market gaps lower to open the second candle below the first, but the second candle has a much smaller red or green body than the first.
The market then gaps up to open the final bullish candle that exceeds the midpoint of the first candle. The morning star pattern captures a moment of market indecision. Traders can watch for this pattern to seek confirmation that an upside reversal is developing after a bear phase.
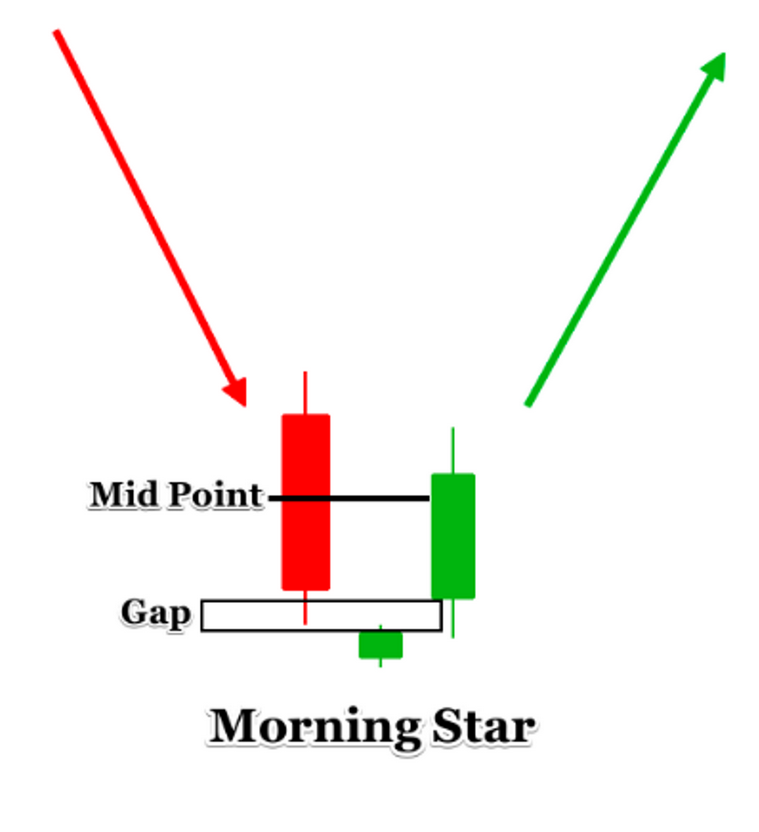
A morning star candlestick pattern. Source: Benzinga.com.
Piercing Line
A piercing line pattern is a two-candle reversal pattern that marks the transition from a downtrend to an uptrend. The first candle of this pattern opens near the high and closes near the low, so it has two small wicks. The second candle then gaps down but closes near its high and above the 50% midpoint of the first candle. This pattern indicates that a near-term upside reversal could take place.
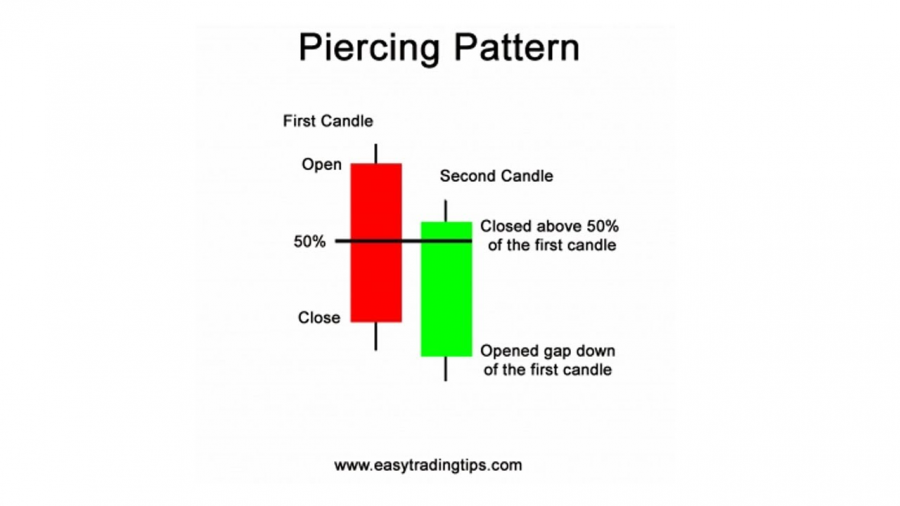
A piercing line pattern. Source: EasyTradingTips.com.
Three White Soldiers
The three white soldiers pattern is the reverse of the three black crows pattern. It involves three green candles that each close above the previous high and tend to have short wicks. This bullish reversal pattern indicates strong upside momentum emerging after a downtrend.
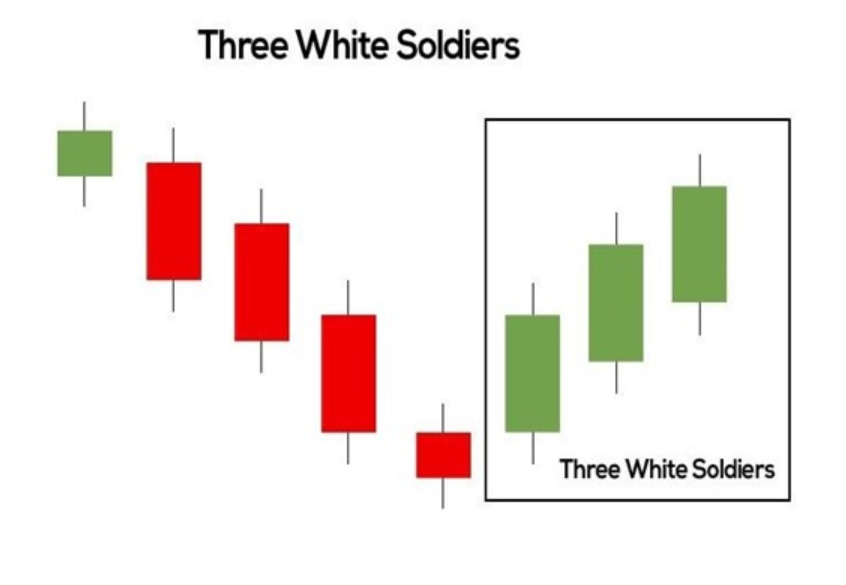
A three white soldiers pattern. Source: Warrior Trading.
Additional Candlestick Patterns Traders Should Know
Over 50 established bullish and bearish candlestick patterns exist to help traders forecast near-term moves in the financial markets. You can research the full range of these useful patterns online and in books dedicated to the subject. A few additional candlestick patterns that traders should be aware of are mentioned below.
Doji
A doji candlestick occurs when the opening and closing levels of a candle are perfectly equal. Doji candles typically show large wicks and bodies that consist of a horizontal line. The directional implication of a doji depends on its form, as the image below shows.
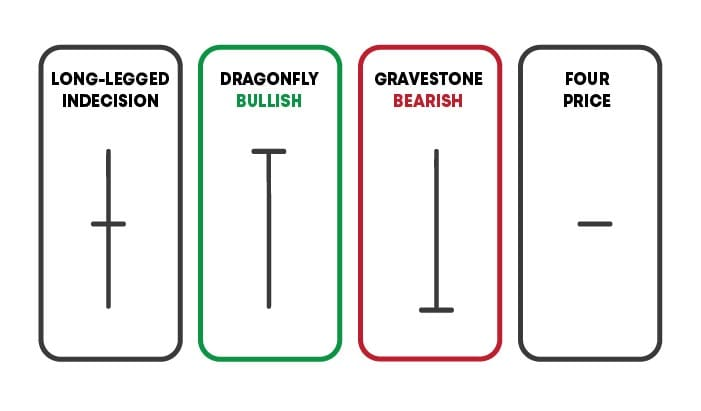
Four types of doji candles and their directional implications. Source: CoinVestasi.com.
Spinning Top
A spinning top candlestick features a short body vertically positioned in the middle of extended upper and lower wicks. When this pattern forms, it represents a period of indecisiveness in the market. The opening and closing levels are similar in spinning top candles, but buyers and sellers attempted to push the market in both directions during its duration. A bullish spinning top has its close above the open, while a bearish spinning top has its open above its close.
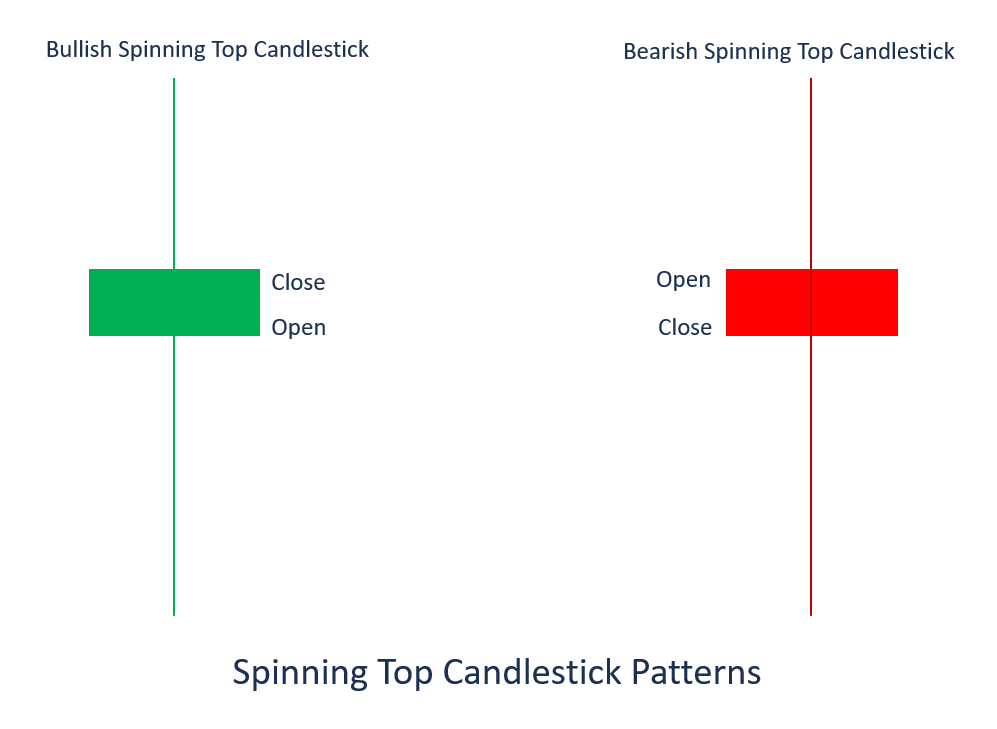
Bullish and bearish spinning top candlesticks. Source: CorporateFinanceInstitute.com.
Falling Three Methods
The falling three methods pattern is a bearish pattern that appears in a downtrend. The first red candle makes a significant move lower and has a large body, but green candles two through four make small gains higher but do not exceed the high or low of the first candlestick. The fifth and final red candle then falls significantly from its open below the previous candlestick’s close to a close below the close of the first candlestick. The falling three methods pattern suggests a bearish trend is likely to remain in effect despite a slight upside correction.
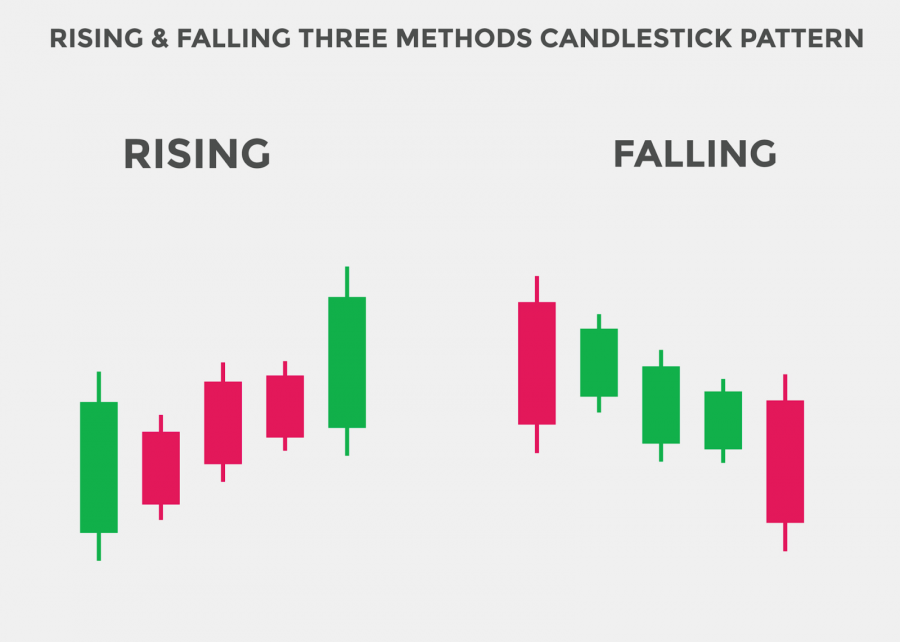
The falling and rising three methods candlestick patterns. Source: Vecteeezy.com.
Rising Three Methods
The rising three methods pattern appears during an uptrend and is the opposite of the falling three methods pattern. In this bullish pattern, the first and last candles are bullish, with the small three candles in the middle correcting modestly lower. This pattern indicates that sellers could not push the market significantly lower, so the uptrend is likely to continue.
Trade Your Strategy
Many very useful candlestick patterns exist to choose from, although how to incorporate them into a forex trading strategy will depend on an individual trader’s preferences. While these patterns can help improve your profitability and edge as a trader when used alone, they usually provide the best trading opportunity when used in combination with other technical indicators that can confirm the validity of their signals.
Learn Candlestick Patterns with These Forex Brokers
Learning about the more reliable candlestick patterns and how to trade them is a great way to boost your success as a forex trader. Getting started putting these patterns into practice generally requires the services of an online forex broker, so look through and compare some of the best forex brokers listed in the table below to help narrow down your options and implement this cheat sheet.
Claim Exclusive Offers
![]()
get started
securely through FOREX.com’s
website
FOREX.com is a one-stop shop for forex traders. With a massive range of tradable currencies, low account minimums and an impressive trading platform, FOREX.com is an excellent choice for brokers searching for a home base for their currency trading. New traders and seasoned veterans alike will love FOREX.com’s extensive education and research center that provides free, informative forex trading courses at multiple skill levels. While FOREX.com is impressive, remember that it isn’t a standard broker.
Best For
- MetaTrader 4 users
- Beginner forex traders
- Active forex traders
- Impressive, easy-to-navigate platform
- Wide range of education and research tools
- Access to over 80 currencies to buy and sell
- Leverage available up to 50:1
- Cannot buy and sell other securities (like stocks and bonds)
![]()
get started
securely through IG Markets’s
website
IG is a comprehensive forex broker that offers full access to the currency market and support for over 80 currency pairs. The broker only offers forex trading to its U.S.-based customers, the brokerage does it spectacularly well. Novice traders will love IG’s intuitive mobile and desktop platforms, while advanced traders will revel in the platform’s selection of indicators and charting tools. Though IG could work on its customer service and fees, the broker is an asset to new forex traders and those who prefer a more streamlined interface.
Best For
- New forex traders who are still learning the ropes
- Traders who prefer a simple, clean interface
- Forex traders who trade primarily on a tablet
- Easy-to-navigate platform is easy for beginners to master
- Mobile and tablet platforms offer full functionality of the desktop version
- Margin rates are easy to understand and affordable
- Access to over 80 currency pairs
- U.S. traders can currently only trade forex
- Customer service options are lacking
- No 2-factor authentication on mobile

Get started
securely through HYCM’s
website
HYCM is 1 of the world’s leading forex brokers, offering investors access to over 69 unique currency pairs. However, forex isn’t the only thing the broker offers — HYCM also offers high rates of leverage, stock and ETF trading, commodity investing and much more. Getting started with HYCM is quick and easy, and most investors can open an account in as little as 10 minutes.
HYCM offers a varying fee structure, which allows investors to choose the spread option that’s best for them. A wide range of educational and investing tools are available, which can be equally beneficial to both experienced and novice traders. Though HYCM isn’t currently available in the United States, it can be a great choice for residents of the other 140 countries where it offers service.
Best For
- Investors who want a customizable fee schedule
- Traders comfortable using the MetaTrader platform
- Islamic traders who need swap-free accounts that don’t build interest
- Mobile app with a simple trading experience
- Wide range of currency pairs available
- Excellent selection of educational tools
- Not currently available to traders based in the U.S.

get Started
securely through CedarFX’s
website
Billing itself as the world’s 1st eco-friendly broker, CedarFX makes it easy to trade and give back to the planet. You can choose a 0% Commission Account or an Eco Account — or open multiple accounts to meet all your needs.
CedarFX offers access to a wide range of tradable securities, including stocks, futures, major and exotic forex pairs, cryptocurrencies and more. Though CedarFX could introduce a few additional educational resources, the broker remains a unique option for traders invested in giving back.
Best For
- Forex investors
- Investors interested in 0% commission or eco conscious trading
- Investors looking for 24/7 customer service
- Allows users to offset their carbon footprint
- 0% commission investing
- Offers demo account access
- 24/7 customer service available through live chat
- Eco Account Option (10 trees planted for each lot traded)
- Fast deposits/withdrawals with Bitcoin
- Limited number of educational resources for new investors

get started
securely through IFC Markets’s
website
Standard Accounts: $1,000
Founded in 2006, IFC Markets is a popular forex and contracts for difference (CFD) broker that provides high-quality trading services to over 185,000 clients from more than 80 countries. The broker has oversight from the British Virgin Islands Financial Services Commission (BVI FSC) as well as the Labuan Financial Services Authority (LFSA) in Malaysia.
IFC Markets offers trading in over 600 financial instruments including forex stocks indices commodities cryptocurrency futures and synthetic assets through excellent trading platforms: MetaTrader 4 and MT5, and its own developed NetTradeX advanced platform. IFC Markets also gives clients unlimited trading opportunities via its unique GeWorko Portfolio Quoting Method that lets traders create their own synthetic instruments or choose from PCI Library synthetic instruments created by professionals.
Best For
- Traders who want to create their own trading instruments
- Intraday and mid-term traders
- Small volume traders
- Trading platforms variety
- The GeWorko Portfolio Quoting Method lets you create synthetic assets
- 15 years experience in the business
- Highly rated by clients with 8 recent international awards
- Insured by AIG Europe Ltd.
- Only regulated by 2 minor agencies
- Not available to traders in the U.S., Japan and Russia

Get started
securely through AvaTrade’s
website
A fully regulated broker with a presence in Europe, South Africa, the Middle East, British Virgin Islands, Australia and Japan, Avatrade deals with mainly forex and CFDs on stocks, commodities, indexes, forex, cryptocurrencies, etc. This brokerage is headquartered in Dublin, Ireland and began offering its services in 2006. It offers multiple trading platforms and earns mainly through spreads.
Best For
- Beginners
- Advanced traders
- Traders looking for a well-diversified portfolio
- Controlled by regulatory agencies of multiple countries
- Choice offered in terms of trading platforms
- Support available in 14 languages and trading platforms in 20 languages
- Practice/demo account available for trying out
- Breadth of trading assets
- Does not accept customers from the U.S. as it isn’t regulated in the U.S.
- Transferring funds to the account may take up to five days; withdrawals could take up to 10 days
Frequently Asked Questions
How many types of candlestick patterns are there?
Candlestick patterns are generally either bullish or bearish, but there are over 50 well-established candlestick patterns for traders to watch for.
Answer Link
Which candlestick is best for scalping?
It can be challenging to narrow down the best candlestick pattern for scalping. For some, it is the shooting star and its inverse pattern the hammer, but opinions differ.
Answer Link
What is a strong candlestick?
Most of the patterns discussed in this article are strong because they show clear and reliable bullish or bearish signals that traders can include in a trading plan.
Answer Link
The post Forex Candlestick Patterns Cheat Sheet by Sam Boughedda, Stock Market Analyst appeared first on Benzinga. Visit Benzinga to get more great content like this.