The post Ascending Triangle Pattern: What it is and How to Trade it by Jay and Julie Hawk appeared first on Benzinga. Visit Benzinga to get more great content like this.
Trade the ascending triangle pattern with CedarFX today.
As you navigate the complexities of the foreign exchange market, understanding chart patterns like the ascending triangle can elevate your currency trading game to new heights. This comprehensive guide to trading the ascending triangle pattern will help you add a powerful tool to your technical analysis arsenal.
In it, Benzinga will explore the intricacies of this easily recognizable classic chart pattern by explaining its identification process and detailing some effective trading strategies that use it. Read on if you find the ascending triangle intriguing and want to see how it fits into your forex trading strategy.
Table of contents
[Show]
What is the Ascending Triangle Pattern?
The ascending triangle pattern is a bullish continuation pattern frequently observed on exchange rate charts by forex traders using technical analysis. This classic chart pattern is formed by two key components: a flat upper resistance line above the pattern and an upward-sloping support line lying below the pattern.
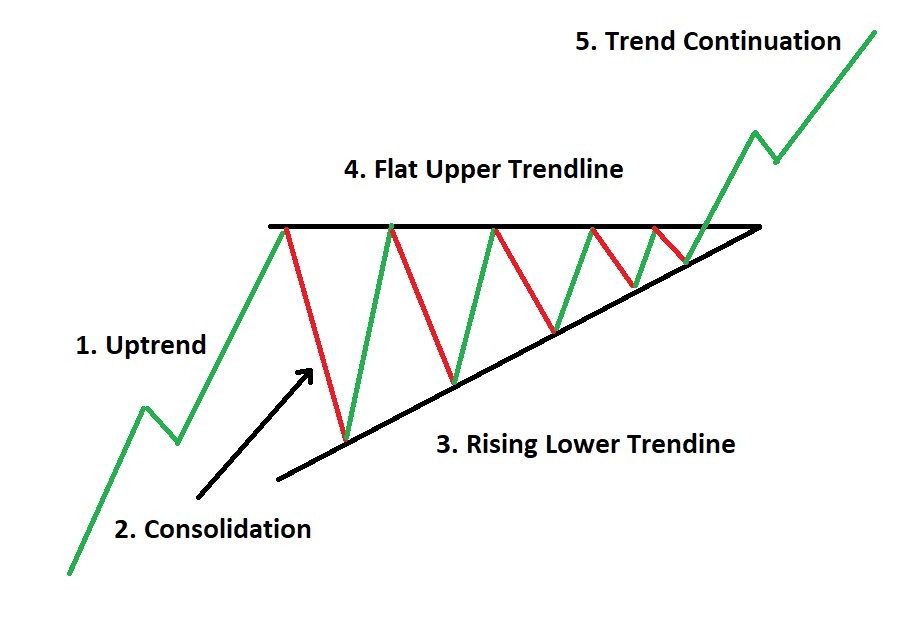
Schematic diagram of the ascending triangle pattern showing its key trendlines. Source: DailyFX.
As the ascending triangle name suggests and the above image illustrates, the pattern takes the shape of a triangle. Its base ascending trendline acts as a rising support line while its horizontal resistance initially inhibits movement above it but eventually gives way as a breakout occurs.
Once you learn to observe its key characteristics closely, you will see that the ascending triangle differs significantly from other classic chart patterns like the pennant and flag patterns. It looks quite distinct from other triangle patterns like the symmetrical, descending and expanding triangles.
Forex traders often look for ascending triangles during uptrends since they signal a potential continuation of the current trend. Trading volume tends to decrease during the ascending triangle pattern’s formation as with most triangle patterns.
Identifying an Ascending Triangle Pattern on Forex Charts
Recognizing the ascending triangle pattern on exchange rate charts is essential for a forex trader to capitalize on its potential. When observing the exchange rate chart for a currency pair, forex traders using this classic chart pattern should pay close attention to its following key characteristics so that they can identify it correctly.
- Flat top resistance line: The pattern’s horizontal top line connects the swing highs that occur within the pattern and serves as a strong resistance level. This level acts as a significant barrier to the upside, preventing the exchange rate from moving higher in the short term before a breakout eventually occurs.
- Upward sloping support line: The ascending trend line that forms the base of the pattern connects the rising swing lows. Its appearance indicates that buyers are becoming increasingly active since they came into the market to push the exchange rate higher with each new low.
- Formation indicates potential breakouts: As the pattern unfolds, the distance between the resistance and support lines gradually narrows to form a converging triangular pattern. This indicates a decrease in the volatility of the exchange rate and may foreshadow an imminent breakout, which typically occurs to the upside.
- Volume tends to decrease: During the ascending triangle pattern’s formation, an observant trader will note that trading volume declines. This reduction in volume traded reflects the forex market’s indecisiveness and a general lack of conviction among traders as the market consolidates and moves upward but not beyond the pattern’s flat top resistance line.
Example of Ascending Triangle Trade Setups
To illustrate the application of the ascending triangle pattern to forex trading, consider a hypothetical trade setup as follows.
Imagine you are analyzing the EUR/USD currency pair’s exchange rate chart, and you notice an ascending triangle forming during an ongoing uptrend. The flat resistance line of the pattern is situated at 1.2500, while the ascending support trendline is currently at 1.2450 and rising. As the pattern unfolds, the exchange rate oscillates between these trending and shows decreasing trading volume during the consolidation phase.
To profit from trading this pattern, you should wait for a clear breakout and look for confirmation from another technical indicator. Once the exchange rate moves convincingly above the resistance level to trade at 1.2510, for example, that would signal a potential bullish breakout of the pattern.
At this point, you could check to see if the pair’s trading volume has risen sharply to provide a reliable confirmation signal. If that is the case, you could enter into a long position in EUR/USD anticipating further upward movement in that currency pair’s exchange rate.
To safely close out your long position just in case the breakout fails because of an unexpected market reversal, you enter a stop-loss sell order in the market placed sensibly below the broken horizontal top line of the pattern. You can enter a take-profit sell order just ahead of the ascending triangle pattern’s measured move objective, which is determined by projecting the initial width of the triangle upward from the breakout point.
Trading Strategies for Ascending Triangle Patterns
Trading the ascending triangle pattern effectively in the forex market generally requires a well-thought-out and disciplined approach involving careful technical analysis and strategic execution incorporated into a detailed trading plan. Explained below are several effective forex trading strategies that can help you capitalize on the potential breakout trading opportunities presented by the ascending triangle pattern.
Breakout Confirmation Strategy
The breakout confirmation strategy is a basic technical approach to trading the ascending triangle pattern. It involves waiting for a clear and convincing breakout above the flat top resistance line. The five steps you can use to execute this strategy are:
- Identify the ascending triangle: First, ensure that you have correctly identified the ascending triangle pattern on the forex chart. Confirm the presence of a flat top resistance line and an upward-sloping support line.
- Wait for a strong upside breakout: Exercise patience and wait for a significant candlestick to close above the resistance line. This confirms the bullish breakout and indicates that buyers have overcome the selling pressure, potentially leading to further upward movement.
- Trade entry: Enter a long position after the breakout confirmation.
- Stop-loss order placement: To protect your capital from potential false breakouts, place a stop loss just below the ascending trendline. This way, if the breakout fails, your losses will be limited.
- Profit target: Determine your profit target using the measured move method. Measure the vertical initial height of the triangle by computing the distance between the rising support line and the flat resistance line and then add it to the breakout point. This gives you an estimated target exchange rate for your trade. You might want to set your take-profit order slightly below that objective to stand a better chance of it being executed.
Retest Strategy
The retest strategy involves waiting for a retest of the breakout level before entering a trade. This approach aims to capitalize on the market’s tendency to retest breakout points, which can offer a better trade entry level and an additional confirmation of the pattern. Here’s how to apply the retest strategy in detail:
- Identify the breakout: After the initial breakout above the resistance line, watch for the exchange rate to pull back and retest the breakout level. The price should ideally touch or come close to the previous resistance, which now acts as support.
- Confirmation of support: Look for bullish candlestick patterns or other technical indicators signaling a rebound from the retest level. This confirms that the former resistance has now turned into support, reinforcing the validity of the breakout.
- Entry and stop-loss placement: Once the retest is confirmed, enter a long position. To manage risk, place a stop loss below the retest level. If the exchange rate falls back below this level, it may indicate a failed breakout.
- Profit target: Use the same profit target calculation as in the breakout confirmation strategy, based on the height of the ascending triangle.
Momentum Oscillator Strategy
The momentum oscillator strategy combines the ascending triangle pattern with a momentum oscillator like the Relative Strength Index (RSI) or the Moving Average Convergence Divergence (MACD) indicator. This strategy helps confirm the strength of the breakout and provides additional insight into market sentiment when it occurs. The steps involved in using the momentum oscillator strategy include:
- Identify the ascending triangle: Start by accurately identifying the ascending triangle pattern on the exchange rate chart.
- Analyze your chosen momentum oscillator: Observe the behavior of the selected momentum oscillator during the formation of the ascending triangle. Look for divergences or convergence between the oscillator and the exchange rate.
- Await confirmation of breakout: Wait for the breakout above the resistance line and look for corresponding signals on the momentum oscillator. If the oscillator shows strong bullish momentum or forms a bullish divergence, it further confirms the validity of the breakout.
- Entry and stop-loss placement: Enter a long position after the breakout is confirmed by the momentum oscillator. Set your stop-loss below the ascending trendline or the retest level, depending on your risk tolerance.
- Compute profit target: Use the same profit target calculation based on the initial height of the ascending triangle.
Wedge Pattern Strategy
The ascending triangle can sometimes morph into a rising wedge pattern, which has a different and more advanced interpretation compared with the standard ascending triangle pattern. The rising wedge pattern strategy can be employed if the exchange rate starts to display a narrowing range as it rises. Here’s how to approach this strategy:
- Identify the ascending triangle and wedge: Initially confirm the presence of the ascending triangle pattern. As that pattern progresses, watch for the exchange rate to start converging between rising trendlines toward the apex of the triangle, thereby forming a rising wedge.
- Wait for breakout confirmation: Just like in the previous strategies, wait for a breakout above the pattern’s upper resistance line. In the case of the wedge pattern, the breakout is expected to occur before the exchange rate reaches the apex.
- Entry and stop-loss placement: Enter a long position after the breakout is confirmed. Place a stop loss below the ascending trendline or the wedge’s lower boundary.
- Profit target: Calculate the profit target as previously described based on the height of the ascending triangle or the wedge pattern.
While each of these trading strategies can provide valuable insights into trading the ascending triangle pattern, keep in mind that no chart pattern strategy is foolproof. Use proper risk management and position sizing practices and consider combining multiple technical indicators for additional confirmation of pattern breakouts. Adapting your strategy to changing market conditions can help improve your long-term success in forex trading.
Tips and Best Practices for Trading Ascending Triangle Patterns
To make the most of ascending triangle patterns and improve your chances of trading the pattern profitably, you can follow these tips:
Patiently Await a Breakout Confirmation
Avoid prematurely entering a trade before a confirmed breakout. Wait for a significant candlestick close above the resistance level to validate the pattern. You want to have the patience to wait for clear signals and avoid impulsive decisions. Remember that false breakouts can occur, so patience is essential.
Analyze the Overall Market Trend
Ascending triangles are most effective when they appear within the context of an uptrend. Assess the larger market trend before trading the pattern.
Using Additional Technical Indicators for Confirmation
While the ascending triangle pattern is a fairly robust trading signal on its own, combining it with other technical indicators, such as trading volume, moving averages or the RSI, can provide additional confirmation and increase the probability of making a successful trade.
Use Proper Risk Management and Position Sizing
Implementing proper risk management is crucial. Place a stop loss just below the ascending trendline to limit potential losses if the breakout fails. As for profit targets, consider using the measured move method by measuring the height of the triangle’s vertical side and adding it to the breakout point. Don’t risk more than you can afford to lose and determine an appropriate position size to establish based on your risk tolerance and the size of your trading account.
Can You Use the Ascending Triangle Pattern Profitably in Forex?
The ascending triangle pattern offers a powerful tool for forex traders seeking to trade uptrends profitably. The pattern has a distinctive shape characterized by a flat top resistance line and an upward-sloping support line that can be readily identified.
The pattern offers valuable insights into potential upside breakouts and when an upward market trend is likely to resume after a consolidation phase. By identifying and confirming the ascending triangle pattern’s formation, currency traders can develop effective trading strategies to enhance their overall success when operating in the forex market.
Frequently Asked Questions
What does an ascending triangle mean?
An ascending triangle is a bullish continuation pattern that can be observed on forex charts. It forms when a flat upper resistance line and an upward-sloping support line converge around the exchange rate, which signals a potential continuation of an uptrend once the market breaks out of the pattern to the upside by trading above the flat resistance line.
Answer Link
Are ascending triangles bullish?
Yes, ascending triangles are bullish continuation patterns. Their formation within an uptrend during a consolidation phase indicates a high probability of the underlying upward trend continuing once a breakout from the pattern occurs.
Answer Link
Can an ascending triangle be bearish?
No, ascending triangles are inherently bullish chart patterns that suggest a potential continuation of an uptrend. For bearish scenarios, traders should instead look for a descending triangle to appear on a chart.
Answer Link
Disclosure: Benzinga was commissioned for this article and is not affiliated with CedarFX. Any comments or opinions provided herein are Benzinga’s. CedarFX does not endorse or promote any trading strategies that may be discussed or promoted herein. The broker makes no representation or warranty as to the article’s adequacy, completeness, accuracy or timeliness for any particular purpose of the above content.
This presentation discusses technical analysis, other approaches, including fundamental analysis, may offer very different views. The examples provided are for illustrative purposes only and are not intended to be reflective of the results you can expect to achieve. This article is for informational and educational use only and is not a recommendation or endorsement of any particular investment or investment strategy. Investment information provided in this content is general in nature, strictly for illustrative purposes, and may not be appropriate for all investors. Investing involves risk regardless of the strategy selected and past performance does not indicate or guarantee future results. Trading leveraged products such as Forex and Cryptos may not be suitable for all investors as they carry a degree of risk to your capital.
The post Ascending Triangle Pattern: What it is and How to Trade it by Jay and Julie Hawk appeared first on Benzinga. Visit Benzinga to get more great content like this.