 Tools to Increase Efficiency and Sales")
Value stream mapping helps you to isolate, communicate, and quantify value vs. waste in a business operation. Read on to find reliable VSM flowcharting tools below.
Sales and operations are the two most critical factors of any business. When you get a sale order, you source raw materials and put those raw materials through a business operations cycle to develop the ordered product. Once the product is ready, you ship it to the customer in exchange for revenue.
From sales to operations and then order fulfillment, businesses must quantify the waste and value addition to the process. This quantification is crucial to improve the business process on successive iterations, increase profit, and reduce overhead costs. Here comes value stream mapping or VSM practice.
Read on to learn the basics of VSM, along with some tools you can use without going through a long learning curve.
What Is Value Stream Mapping (VSM)?
Value stream mapping, or VSM, is a flowcharting technique to illustrate, examine, and improve the steps needed to manufacture or deliver a product or service. Business management experts consider VSM a key part of lean business methodology.
VSM visualizes the flow of information and process steps from the source to the delivery point, either a dealer or end user. Just like other types of flowcharts, VSM uses an array of standard and globally accepted symbols to denote various process activities along with the information flows.
VSM looks at the business process from the value-adding point of view. Anything in a business process that does not contribute to revenue-making is waste. Thus, a carefully researched and crafted VSM flowchart will tell how much money and time going to waste and value addition. From there, you can reduce the wastage steps, and the value addition will increase as a result when you minimize waste.
How Does the Value Stream Mapping (VSM) Work?
According to Lean business methodology, VSM helps you quantify all the steps and working hours needed to develop a service or product from codes or raw materials. All the steps in between are considered for value addition and wastage.
For example, if you keep storing eCommerce platform inventory in a warehouse, it is considered a wastage in VSM. On the contrary, when you source merchandise from third parties and immediately deliver that to the customer, it is a value addition to the sales and operations of your eCommerce business.
The main focus of this flowcharting technique is to create a future state roadmap for minimal waste and maximum value addition. Additionally, you will find the implementation idea from VSM flowcharting.
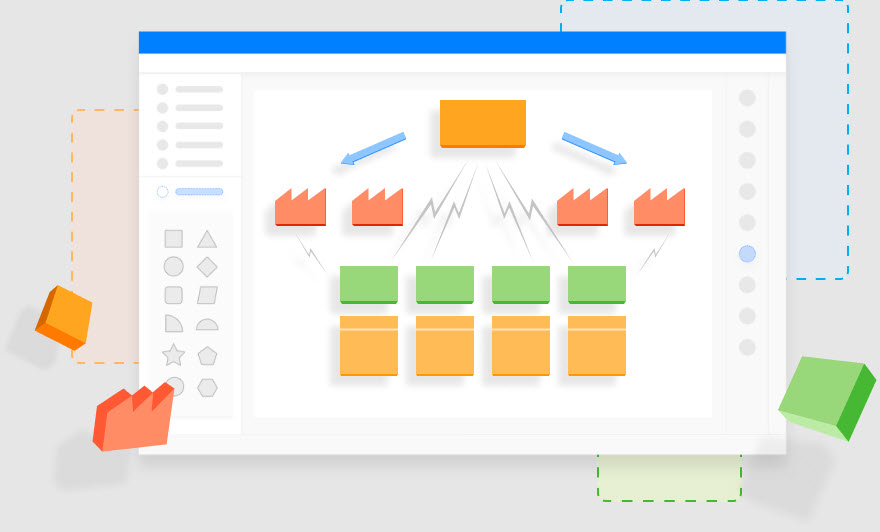
The Symbols of Value Stream Mapping (VSM)

1. Process Symbols in VSM
- Factory icon for customer and supplier
- A file folder to denote process flows
- A file folder with a stripped box for shared process
- Stacked boxes denote a data box
2. Material Symbols in Value Stream Maps
- The upright triangle denotes the inventory
- The forward arrow denotes shipments
- A truck icon for external shipment
3. Information Symbols in VSM
- A lightning arrow denotes electronic information
- The radio button for sequenced pull
4. General Symbols in Value Stream Mapping
- Spiked chat box or message box for Kaizen burst
- A simple box for other useful information
- Numbered circle with an overarching half-circle denotes the process operator
How to Conduct a Value Stream Mapping (VSM)
- Identify the customer pain points you want to solve. This will automatically reduce waste and enhance value addition.
- Document the user pain points under a column using sticky notes.
- Create a team of experienced project stakeholders who can brainstorm the entire process and contribute problem-solving ideas.
- Delimit the VSM flowcharting to a specific process that, upon modification, should reduce or eliminate customer pain points. It is not always necessary to map out the whole process.
- Gather business process data and put the data in the right symbols on a VSM tool or editor.
- Assess the current process map from all aspects to pinpoint all the value addition and waste steps.
- Create a future state map by reducing waste mathematically without impacting the end result.
- Approve or get approval from the process owner or client to implement the changes.
Now that you explored the basics of the value stream mapping process, find below the tools you can use to create professional value stream maps for any business:
Creately

Creately’s VSM tool assists you in effortlessly identifying non-value-adding or wasted steps in your existing business process. When you can visualize the value addition and wasted efforts in an easily visualized dashboard, you can take steps to reduce waste. When you reduce waste, value addition increases automatically.
The notable features of the Creately tool for the value stream mapping process are as follows:
- You can get cross-functional teams onboard to a remote collaborative VSM process with real-time inputs from all the team members when creating a value stream map.
- You do not need to use one template for different VSM scenarios. Simply choose the right template from a vast collection of Creatly VSM templates.
- If your VSM is about a complex process mapping, then Creatly has got you covered. Its shapes library contains many VSM process shapes used by VSM experts worldwide.
- Drag and drop actions for creating professional and business-grade value stream maps.
SmartDraw

SmartDraw VSM editing tools make it easy to place the process map, its corresponding timeline, and the overall information flow in a standard VSM flowchart. In the process, VSM experts and managers use specialized symbols. SmartDraw has a vast library of these symbols, along with useful explanations.
So, you can simply drag and drop the shapes on its flowcharting canvas to create a VSM in a flash. Most of the shapes come with the industry standard text annotation for VSM flowcharting. Hence, there is less manual typing. You can use the time saved in value stream mapping to brainstorm value-addition steps.
It offers a range of VSM-sharing options. For example, you can create a live link and share it with the collaborators. Then, the invitees can join online to contribute to perfecting the value stream map. Other VSM export options are Visio files, PDF, SVG, JPG, and more.
LucidChart

LucidChart VSM tool enables you to optimize and visualize your business process through a flowchart of components and communications in the process. The notable features for which you might want to give LucidChart VSM software a try are as outlined below:
- Automate the entire VSM process by using conditional formatting and data linking to the VSM flowchart.
- Linked data points and mathematical formulas help you to analyze a process value stream with a bird’s eye view.
- Creators can share the VSM flowchart with project members either for commenting or direct editing through role-based access control.
- The tool can create graphs from linked data and modify the shapes automatically as the numbers go up or down.
- Strong version controlling system to track every small or big change made throughout the VSM flowchart lifecycle.
Visual Paradigm

Visual Paradigm is a cloud-based VSM flowcharting tool. You do not need to install any app to get started with value stream mapping. Also, you can efficiently and affordably collaborate with project or process stakeholders when creating or updating a VSM flowchart on Visual Paradigm. Since no installation is needed, anyone can jump in to comment or add content to perfect the overall VSM flowchart.
The Visual Paradigm VSM editor comes with all the standard VSM symbols you see in any business-grade VSM flowchart. Also, it contains some additional creative and professional shapes that will add more value to your VSM process.
The notable user experience you can expect from this VSM app is as follows:
- Full drag and drop editing, no coding required
- Embed the VSM flowchart graphic into apps like MS Word, Excel, PowerPoint, Outlook, OneNote, etc., for business needs.
- Export diagrams in standalone visual formats like PDF, JPG, SVG, GIF, PNG, etc.
EdrawMax
If you are looking for informative and self-explanatory value stream mapping flowcharts, you can also give EdrawMax a try. This online flowcharting tool comes with a vast library of business-grade VSM flowcharts. If you like to create your own flowchart from scratch, you will find all the standard value stream map symbols that the expert VSM managers use.
Whether you are an experienced or novice VSM creator, it does not matter a lot when you use the EdrawMax Online tool. Its symbols are pretty self-explanatory, along with detailed information on how to use the app.
For remote sharing purposes, you can create different access levels to the shared flowchart using cloud authentication and role-based access rights. Thus, you can allow some team members to add more content or some to just review and comment without making any changes to the original VSM flowchart.
Microsoft Visio

If you use Microsoft 365 tools for business or personal needs, you can use Visio to create outstanding VSM flowcharts. However, there is a catch when you prepare to use Microsoft tools for value stream mapping. The symbols and components for VSM in Visio are only available with the following subscriptions or versions of the Visio app:
- Visio Plan 2
- Visio Professional 2021
- Visio Professional 2019
- Visio Professional 2016
- Visio Professional 2013
- Visio Premium 2010
In Microsoft Visio, you must create all the VSM flowcharts from scratch since there are no templates. You will find the necessary symbols and connectors in the Value Stream Map Shapes stencil. Simply drag and drop the elements on the Visio canvas and annotate them using text boxes. The process is time-taking without templates.
FlowBreeze

If you are looking for an easy and affordable way to map information flow and material usage in a business process, you should try out the FlowBreeze VSM flowcharting tool. It works as an Excel Add-in tool to infuse value stream mapping functionalities into Excel standalone installations on Windows computers.
The tool consists of the following two modules:
- VSM Symbols Task Pane functions as an additional Excel ribbon menu to create VSM flowcharts from scratch by dragging and dropping symbols on Excel.
- Value Stream Mapping Template Generator assists you to create business-ready VSM diagrams in a flash using pre-configured templates.
Excel is a preferred place for many project and manufacturing plant supervisors for VSM flowcharting. Because Excel gives you real-time access to the business process data on which you draw the VSM.
VSM Templates You can Download
1. Value Stream Mapping Template From Miro

This VSM template from Miro helps you to draft a VSM from scratch, plan the future state map, and implement the modifications to increase value within the business process. The template automatically populates the sticky notes you need, like the following:
- How to define the scope of the VSM process
- What is the present state of the process
- What should be the future state of the process
- What should be the implementation plan
You can start using the template by signing up for a free Miro account. Then download the template as a draft when you have added more content to the template using the Miro whiteboard editing tool.
2. Free Value Stream Mapping Template From FigJam
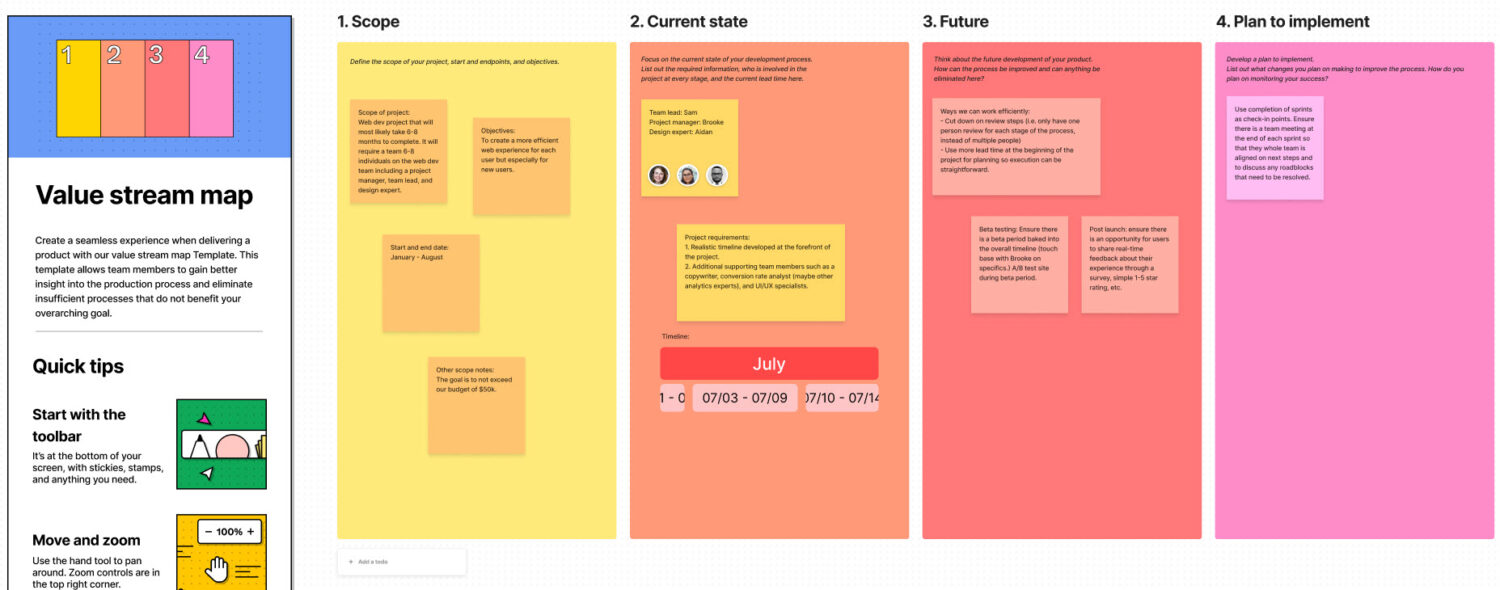
If you manage a development project or routine business process, you can try out this effortless VSM template from FigJam. It is free for business and personal use. You can create a free Figma or FigJam account using Google or other emails to gain copy access to the template.
The FigJam VSM flowchart template has the following sections:
- Scope
- Current state
- Future
- Plan to implement
Each section has some pre-populated sticky notes that you can modify according to the project you are managing. If you need more sticky notes, you can add more. Once you complete the mapping, you get to finalize the implementation plan that will enhance the end result of the project.
Wrapping Up
In Lean business methodology, value stream mapping is the cornerstone tool to assess value vs. waste in a business process. Various industries use different versions of VSM to perform an initial assessment of their value stream process and then minimize waste from the timeline. It requires a lot of practice and flowcharting knowledge to create professional VSM flowcharts.
But you can do that in less time using the VSM tools and templates mentioned above in this article.
Next up: Service Blueprint Diagram Explained [+ 5 Resources].